


Keeling Curve Discovery (1958)
Charles David Keeling installed a carbon dioxide monitoring instrument at the Mauna Loa Observatory in Hawaii, beginning continuous atmospheric CO₂ measurements. His first reading recorded 313 parts per million. Within two years, the data showed a clear upward trend underlying seasonal variation—the first direct evidence that human activities were measurably increasing atmospheric CO₂.
The scientific community gained the first reliable baseline for atmospheric CO₂, though climate change remained a fringe concern in policy circles.
The Keeling Curve became the most iconic dataset in climate science, directly informing the formation of the IPCC in 1988 and providing the evidentiary foundation for international climate negotiations.
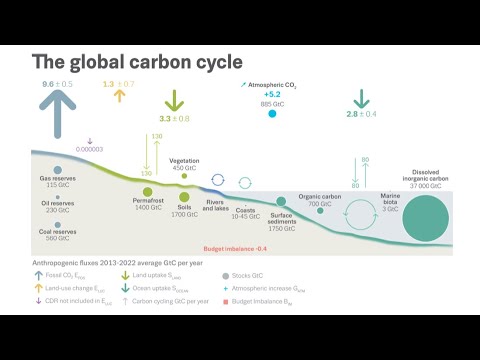
The January 2026 study refines the picture that began with Keeling's measurements. While Keeling showed CO₂ was accumulating in the atmosphere, this study reveals that less of it is being absorbed by land than scientists assumed—meaning more of humanity's emissions stay in the atmosphere than previous carbon budgets indicated.