

Pull to refresh
Logo
Income hit a record and poverty fell in 2025, with safety net cuts looming

Income hit a record and poverty fell in 2025, with safety net cuts looming

Rule Changes

Census data show 2025 gains that mostly predate the One Big Beautiful Bill Act's food and Medicaid cuts

Today: Census releases 2025 income, poverty, and coverage data

Overview

Updated 43 minutes ago

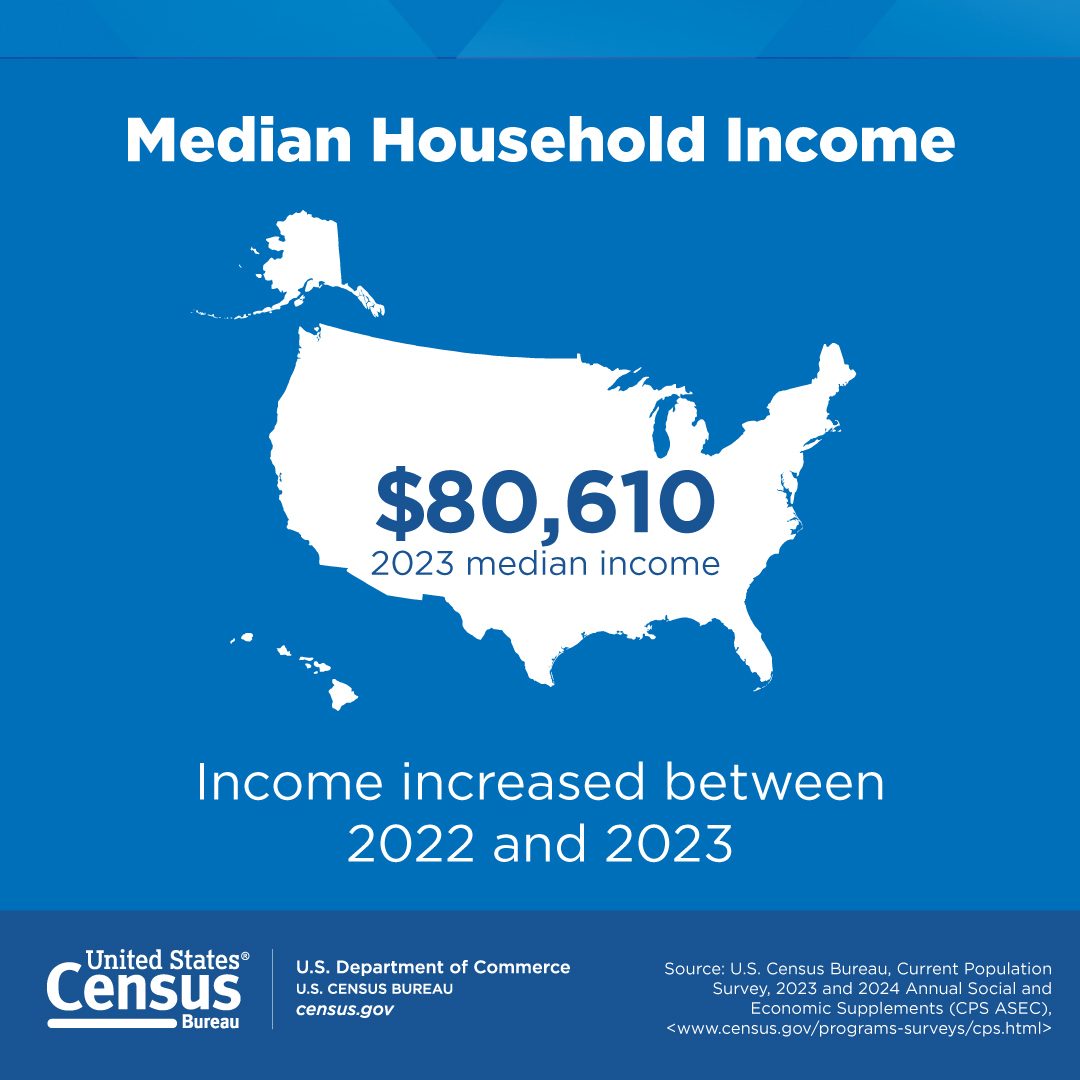
The Census Bureau reported Tuesday that median household income reached $87,460 in 2025, the highest on record since 1967 and up 2.6% from $85,210 the year before. The official poverty rate fell half a point to 10.2%, and child poverty dropped to a historic low of 13.4%.

Those gains mostly predate the One Big Beautiful Bill Act, the reconciliation law signed in July 2025 that cut SNAP (food stamps) and Medicaid. SNAP enrollment has already fallen by roughly 5 million people since the law took effect, and analysts at the Center on Budget and Policy Priorities and the Center for American Progress expect the cuts to surface in next year's poverty numbers.

The report's supplemental poverty measure, which counts tax credits and benefit programs, stayed flat at 13.1%. Medical expenses alone pushed 7.7 million people into poverty under that measure, an effect that will grow as health coverage is expected to shrink.

Why it matters

34.5 million Americans were poor in 2025; the food aid and Medicaid cuts now phasing in could push that number higher.

Questions about this story

Free account needed to ask — your question is kept and asked for you right after sign-up. Answers are public.

No questions yet — be the first to ask.

Key Indicators

$87,460
2025 median household income
Up 2.6% from $85,210 in 2024; the highest on record since 1967.
10.2%
Official poverty rate
Down 0.5 points from 2024; 34.5 million people in poverty.
13.4%
Child poverty rate
A historic low, down a full percentage point from 2024.
13.1%
Supplemental poverty measure rate
Statistically unchanged from 2024; counts tax credits and benefits.
7.9%
Share of Americans uninsured in 2025
26.7 million people; unchanged from 2024 but before most Medicaid and ACA cuts.
5,000,000
Drop in SNAP enrollment, July 2025–May 2026
USDA data show roughly 1.2 million of the losses were children in reporting states.

Voices

Curated perspectives — historical figures and your fellow readers.

Ever wondered what historical figures would say about today's headlines?

Sign up to generate historical perspectives on this story.

People Involved

Organizations Involved

Timeline

July 2025 September 2026

4 events Latest: Today
Tap a bar to jump to that date
  1. Census releases 2025 income, poverty, and coverage data

    Today Data Release

    Median household income rose 2.6% to a record $87,460; official poverty fell to 10.2%; uninsured rate held at 7.9%.

  2. SNAP participation down about 5 million

    Data

    Enrollment fell another 2.6 million in early 2026; roughly 1.2 million losses were children in reporting states.

  3. SNAP enrollment drops sharply after law's enactment

    Data

    USDA administrative data show participation fell roughly 2.4 million from July to December 2025.

  4. One Big Beautiful Bill Act signed into law

    Policy

    The 2025 reconciliation law cuts SNAP and Medicaid, with most provisions phasing in from late 2025 through 2026.

Scenarios

1

Poverty rises in 2026 as the One Big Beautiful Bill's cuts take hold

Likely Resolves by Sep 15, 2027

Discussed by: Center on Budget and Policy Priorities; Center for American Progress

Next year's report, due September 2027, captures a full year under SNAP restrictions, Medicaid work requirements, and expired Affordable Care Act premium tax credits. SNAP enrollment has already fallen roughly 5 million since July 2025, and CAP projects 14.2 million more uninsured by 2034. Analysts expect the supplemental poverty measure — the metric that counts benefits — to climb.

2

Income gains hold as the labor market absorbs the cuts

Possible Resolves by Sep 15, 2027

Discussed by: Analysts citing real wage growth and low unemployment

The official poverty measure counts only pretax income, so many benefit cuts do not register in it. If wages keep rising faster than benefit losses and unemployment stays low, 2026 median income could hold at or above its record and the official rate could stay near 10.2%, even as the SPM worsens. This would produce a growing divergence between the two poverty measures.

3

A state ends its SNAP program as cost-sharing kicks in

Possible Resolves by Oct 1, 2027

Discussed by: Center on Budget and Policy Priorities

Starting October 1, 2027, states must cover 5–15% of SNAP benefit costs for the first time in the program's history. CBPP warns some states may decide they cannot or will not pay, and could terminate their programs entirely. A single state withdrawal would be the largest structural change to food assistance since the program's creation.

Historical Context

2 moments from history that rhyme with this story — and how they unfolded.

August 1996 – 2000s

Welfare reform (1996)

The Personal Responsibility and Work Opportunity Reconciliation Act replaced the Aid to Families with Dependent Children entitlement with Temporary Assistance for Needy Families, ending guaranteed cash assistance and imposing time limits. Caseloads fell by more than half within five years as states tightened rules.

Then

Cash assistance rolls and spending fell sharply while employment rose during the late-1990s boom.

Now

Benefits eroded in real terms over decades, and the safety net shifted away from cash aid toward in-kind programs like SNAP.

Why this matters now

Structural benefit cuts take years to fully show up in poverty data — a reminder that the 2025 law's full effect may not appear for several annual reports.

July 2021 – December 2022

Child Tax Credit expansion and expiration (2021–2022)

The American Rescue Plan expanded and made the Child Tax Credit fully refundable in 2021, cutting that year's child poverty to a record low. When the expansion expired at the end of 2021, child poverty nearly doubled to 12.4% in 2022 even though the economy kept growing.

Then

The 2022 data showed the sharpest one-year rise in child poverty on record.

Now

Established that measured poverty can swing dramatically with benefit policy, independent of the business cycle.

Why this matters now

Shows how quickly reversing a benefit program moves poverty statistics — the dynamic analysts expect from the 2025 safety net cuts.

Sources

(11)