



Pull to refresh
Logo
US existing-home sales fall to 16-year low as mortgage rates stay high

US existing-home sales fall to 16-year low as mortgage rates stay high

Money Moves

October sales ran at a 3.75 million annual pace, the weakest since August 2010.

Overview

Updated 1 hour ago

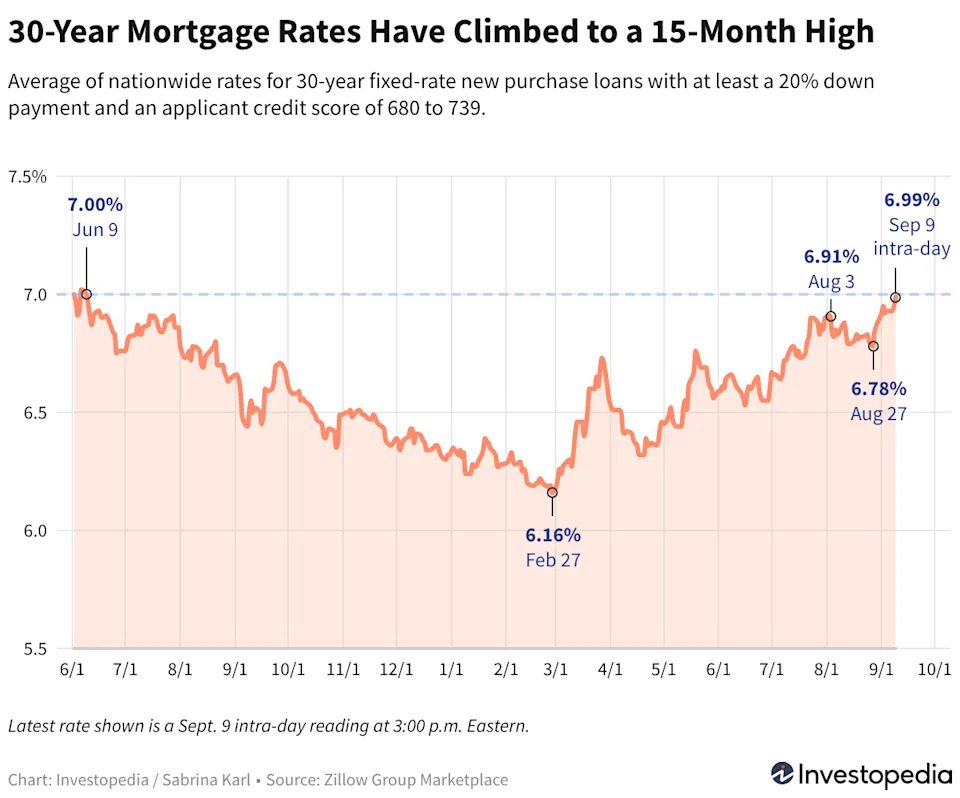
US existing-home sales fell to a seasonally adjusted annual rate of 3.75 million in October, the lowest since August 2010. Sales dropped 5.5% from September and 8.8% from a year earlier as 30-year mortgage rates held above 7%.

The slump is not a supply crash. Inventory rose to 1.59 million homes, or 5.1 months of supply, the most since November 2015. Prices still rose 0.4% from a year earlier, leaving first-time buyers squeezed between high borrowing costs and high home prices.

Why it matters

Mortgage rates above 7% are freezing the US housing market, locking out first-time buyers and trapping existing homeowners in low-rate loans.

Questions about this story

Free account needed to ask — your question is kept and asked for you right after sign-up. Answers are public.

No questions yet — be the first to ask.

Key Indicators

3.75M
October existing-home sales pace
Seasonally adjusted annual rate, the lowest since August 2010.
5.5%
Monthly sales decline
Drop from September's pace.
8.8%
Annual sales decline
October sales versus a year earlier.
1.59M
Existing homes for sale
Inventory rose 1.3% from September and 4.6% from a year earlier.
5.1 months
Months of supply
At October's sales pace, the most since November 2015.
7.40%
30-year mortgage rate peak
Freddie Mac's early-October high, a three-year peak.
29%
First-time buyer share
Down from 31% in September and 32% a year earlier.

Voices

Curated perspectives — historical figures and your fellow readers.

Sign up to generate historical perspectives on this story.

People Involved

Organizations Involved

Timeline

September 2026 November 2026

4 events Latest: 2 days ago
Tap a bar to jump to that date
  1. October sales slump tops r/Economics weekly thread

    Latest Discussion

    A Reddit post on the 16-year low becomes the forum's top item for the week.

  2. October existing-home sales fall to 3.75 million pace

    Economic data

    NAR reports a 5.5% monthly drop and an 8.8% annual decline, the lowest since August 2010.

  3. 30-year mortgage rate hits 7.40%

    Market

    Freddie Mac records a three-year high, the peak of the fall rate spike.

  4. Fed raises short-term rate by a quarter point

    Policy

    The Federal Reserve raises its benchmark rate 25 basis points, adding pressure to mortgage rates.

Scenarios

1

Mortgage rates ease and sales rebound by spring

Possible Resolves by Q1 2027

Discussed by: Lawrence Yun of the National Association of Realtors and Danielle Hale of Realtor.com

If the 10-year Treasury yield stays below its October peak and 30-year mortgage rates drift toward the high 6% range, buyers could return during the spring selling season. Yun said sales could improve in November and December if rates continue to relax. Hale said the yield has pulled back, but several factors put a floor under rates.

2

Rates stay above 7% and sales stay near a 16-year low through winter

Likely Resolves by Feb 28, 2027

Discussed by: Lisa Sturtevant of Bright MLS

Sturtevant expects sticky inflation to push mortgage rates higher again before year-end. With both buyers and sellers slowing, sales could stay near October's depressed pace into winter. The test is whether NAR reports another string of sub-4 million annual rates.

3

Inventory builds and annual price growth turns negative

Unlikely Resolves by Q2 2027

Discussed by: Housing economists including Lisa Sturtevant, who sees limited odds of a sharp price drop

Supply has risen above five months for the first time since 2015. If listings keep climbing and buyers stay sidelined, sellers could lose pricing power. Sturtevant argues that slower selling by both sides makes a significant decline unlikely, so this scenario requires a clear break in the supply-demand balance.

Historical Context

3 moments from history that rhyme with this story — and how they unfolded.

1980-1982

Volcker shock and the 1981-82 housing recession (1980-1982)

The Federal Reserve pushed its benchmark rate toward 20% to break double-digit inflation. The 30-year fixed mortgage rate rose above 18% in 1981, and housing starts fell by more than half from their 1978 peak.

Then

The economy entered a deep recession, with unemployment above 10% in 1982.

Now

Inflation fell, and housing began recovering in 1983 as rates eased. The episode established that rate shocks can freeze sales long before prices adjust.

Why this matters now

Today's 7% mortgage rates are far below 1981 levels, but the mechanism is similar: higher borrowing costs push buyers out and stall transactions.

2022-2023

2022-2023 mortgage-rate shock (2022-2023)

The 30-year fixed mortgage rate more than doubled from about 3% to nearly 8% as the Federal Reserve raised rates. Existing-home sales fell to their lowest level in nearly three decades.

Then

Sales froze, but national home prices dipped only briefly because inventory stayed low.

Now

The market settled into a low-volume, high-price equilibrium, with many homeowners locked into cheap mortgages.

Why this matters now

The October 2026 slump repeats that pattern: few transactions, still-rising prices and a divide between cash buyers and first-time buyers.

2006-2011

US housing bust (2006-2011)

Existing-home sales fell for years as subprime lending collapsed. Inventory surged and national home prices fell about 27% from their 2006 peak.

Then

Foreclosures spread, banks failed and the recession deepened.

Now

The bust led to tighter mortgage rules and a decade of weak homebuilding.

Why this matters now

Today's low inventory and tighter credit make a repeat price collapse less likely, even as sales hit a 16-year low.

Sources

(7)