


Pull to refresh
Logo
New England wind generation surges as capacity additions accelerate

New England wind generation surges as capacity additions accelerate

Built World

Monthly wind output in ISO-NE averaged 68% higher in 2026's first nine months than a year earlier

Today: EIA reports 68% average increase in monthly wind generation

Overview

Updated 1 hour ago

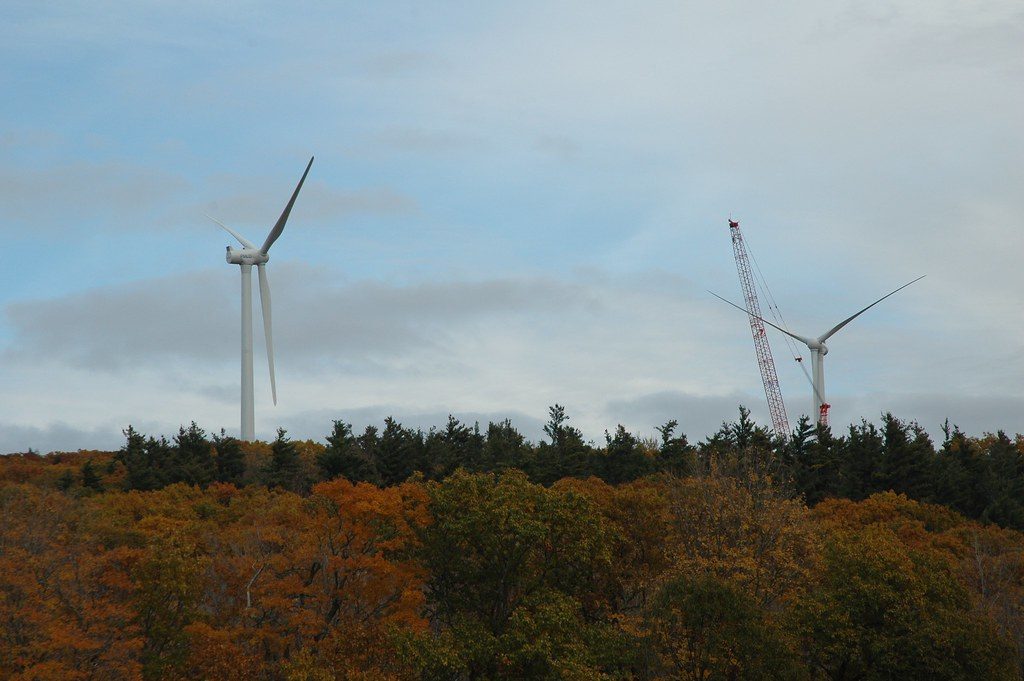
New England's wind farms generated 68% more electricity in the first nine months of 2026 than in the same stretch of 2025. September produced 668.9 gigawatt-hours, more than double September 2025 and the region's highest monthly total this year.

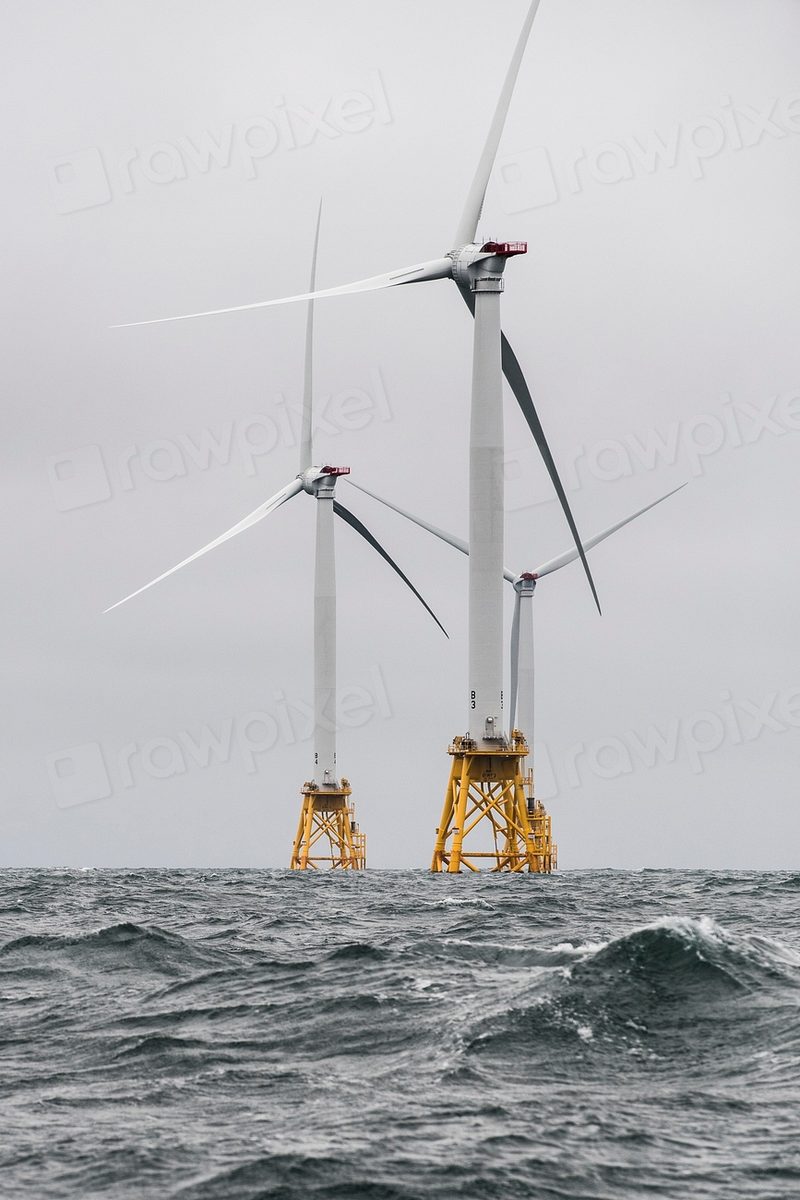
The growth tracks capacity additions. Regional wind capacity rose 47% in 2026 to 2.5 gigawatts, after a 12% increase in 2025. Offshore wind is a growing share, with output peaking at about 1,100 megawatts on September 24.

Why it matters

New England's grid is shifting toward wind, changing how the operator plans for peak demand and winter reliability.

Questions about this story

Free account needed to ask — your question is kept and asked for you right after sign-up. Answers are public.

No questions yet — be the first to ask.

Key Indicators

68%
Average increase in monthly wind generation, Jan-Sep 2026 vs 2025
EIA reported the increase in its October 14 Today in Energy analysis.
2.5 GW
Regional wind capacity
Capacity grew 47% in 2026 after a 12% increase in 2025.
668.9 GWh
September 2026 wind generation
More than double September 2025 and the year's highest monthly total.
4,619 GWh
Wind generation, Jan-Sep 2026
Already 1.9% more than the full-year 2025 total of 4,533 GWh.

Voices

Curated perspectives — historical figures and your fellow readers.

Ever wondered what historical figures would say about today's headlines?

Sign up to generate historical perspectives on this story.

Organizations Involved

Timeline

2025 October 2026

8 events Latest: Today
Tap a bar to jump to that date
  1. EIA reports 68% average increase in monthly wind generation

    Today Report

    Today in Energy analysis covers Jan-Sep 2026, citing capacity growth and offshore wind output.

  2. Daily wind generation sets new record at 47.3 GWh

    Data

    Output edged 1% above the September 10 peak.

  3. Combined wind output peaks at about 2,000 MW

    Data

    Onshore and offshore wind together reached their highest combined output.

  4. Offshore wind output peaks at about 1,100 MW

    Data

    Offshore output hit its high during a nor'easter that had minimal transmission impact.

  5. Daily wind generation peaks at about 46.8 GWh

    Data

    Daily wind output set a record that would stand for less than a month.

  6. September wind generation hits 668.9 GWh

    Data

    Monthly output more than doubled September 2025 and set the year's high.

  7. March sets year's wind generation high

    Data

    March wind generation was the year's high before September surpassed it by nearly 10%.

  8. Wind capacity grows 12% in ISO-NE

    Capacity

    Regional wind capacity increased 12% during 2025, setting up faster growth in 2026.

Scenarios

1

Wind capacity keeps climbing as offshore projects connect

Likely Resolves by End of 2027

Discussed by: EIA and ISO-NE reports

More offshore wind projects come online through 2027, pushing capacity and generation higher. State procurement targets and ISO-NE's interconnection queue support continued growth. The 47% capacity increase in 2026 suggests the buildout has momentum.

2

Transmission constraints cap wind growth

Possible Resolves by End of 2027

Discussed by: ISO-NE and NEPOOL

Grid congestion and interconnection limits slow new wind connections. Curtailment events rise as wind output outpaces transmission capacity, especially in winter when gas pipelines are constrained. ISO-NE has noted significant transmission outages scheduled in coming months.

3

Winter storm tests wind's reliability contribution

Uncertain Resolves by Apr 30, 2027

Discussed by: ISO-NE winter outlook

The 2026-2027 winter tests whether wind can contribute during peak heating demand, when gas pipelines are constrained. A strong winter performance could accelerate the transition; a weak one could slow it. ISO-NE presents its Winter Outlook at the November Participants Committee meeting.

Historical Context

2 moments from history that rhyme with this story — and how they unfolded.

2000-2019

Texas wind buildout (2000s)

Texas went from about 180 megawatts of wind capacity in 2000 to over 24,000 megawatts by 2019, becoming the nation's wind leader. The state approved billions in transmission lines through Competitive Renewable Energy Zones to move wind from rural areas to cities.

Then

Wind generation grew from negligible to a major share of Texas electricity.

Now

Texas showed that transmission investment and capacity additions can rapidly scale wind generation.

Why this matters now

New England is following a similar pattern, with capacity additions driving generation growth, though on a smaller scale and with offshore wind as a new factor.

1991

Vindeby offshore wind farm (1991)

Denmark built the world's first offshore wind farm at Vindeby, with 11 turbines totaling 5 megawatts. The project proved offshore wind was technically feasible.

Then

Offshore wind remained niche for years.

Now

It launched an industry that now supplies significant power in Europe and is expanding in the U.S.

Why this matters now

New England's offshore wind buildout is part of this technology's maturation, with output now peaking above 1,000 megawatts in the region.

Sources

(5)