

Pull to refresh
Logo
71.5% of U.S. coastal land is sinking, study finds

71.5% of U.S. coastal land is sinking, study finds

Built World

Ground-level subsidence compounds sea-level rise and raises flood risk for millions of coastal residents

Today: National subsidence map: 71.5% of U.S. coast sinking

Overview

Updated 1 hour ago

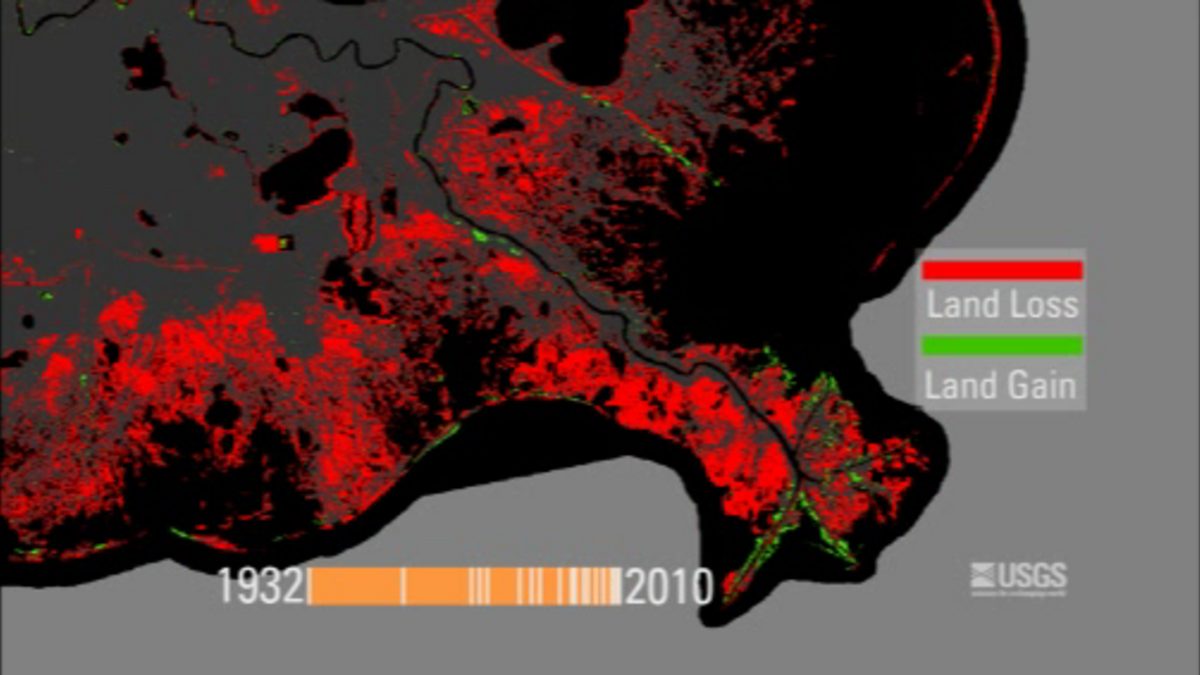
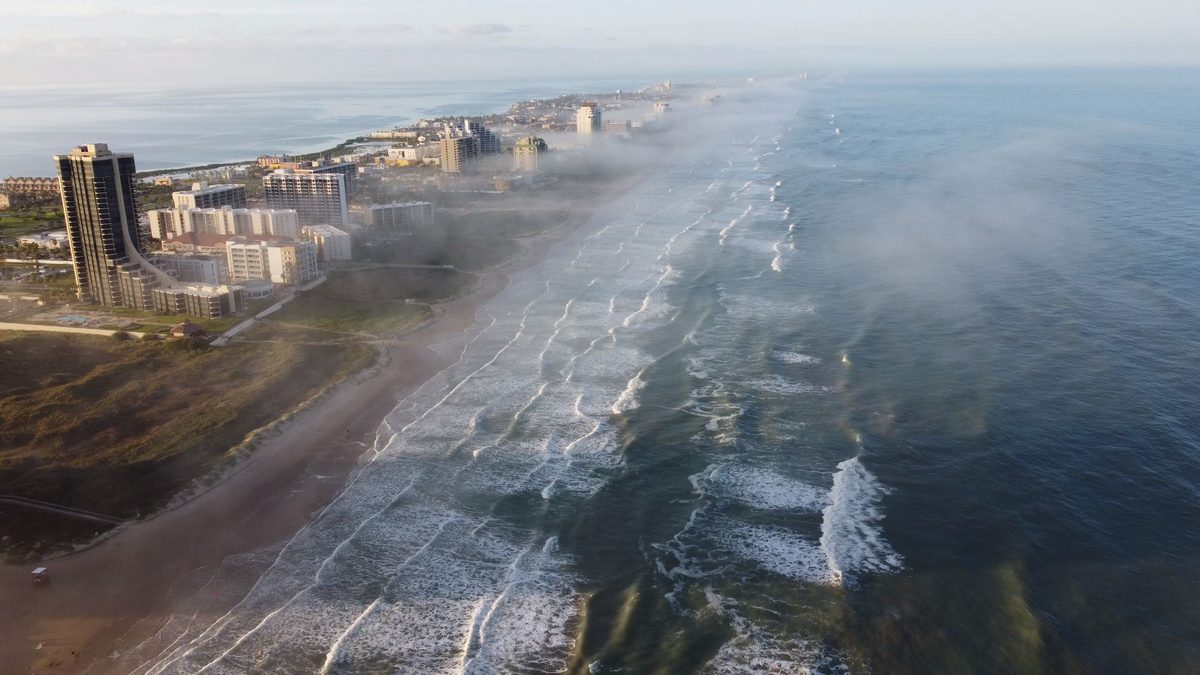
The ground under America's coasts is moving downward faster than scientists had mapped. New research analyzing more than 190 million data points finds that 71.5% of U.S. coastal areas are sinking at least 1 millimeter per year, with the Gulf Coast sinking fastest. Nearly a quarter of the coastline drops 3 millimeters or more annually.

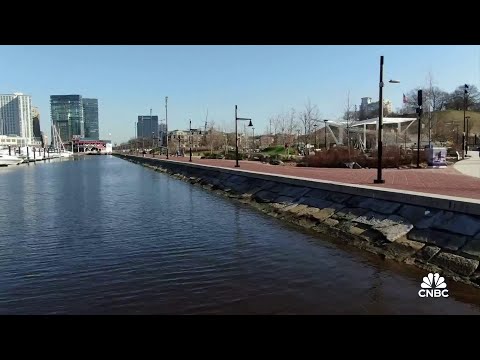
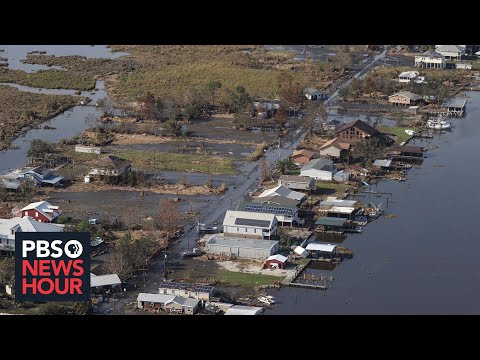
That subsidence compounds rising seas. Global sea levels are climbing, and where the land also falls, the relative rise is roughly double the climate-driven rate alone. This means more chronic tidal flooding, stressed levees and sea walls, saltwater creeping into farmland and freshwater supplies, and damage to roads, railways, airports, and buildings that tens of millions of people rely on.

Why it matters

Sinking land plus rising seas means more flooding, damaged infrastructure, and higher costs for coastal residents within decades.

Questions about this story

Free account needed to ask — your question is kept and asked for you right after sign-up. Answers are public.

No questions yet — be the first to ask.

Key Indicators

71.5%
U.S. coastal area sinking faster than 1 mm per year
Rates vary by region; the Gulf Coast shows the fastest subsidence.
43%
Coastal area sinking 2 mm/year or more
About half of the U.S. coast is dropping at double the 1 mm threshold.
23.3%
Coastal area sinking at least 3 mm/year
Developed regions, wetlands, and farmland are all affected at this rate.
867,000+
Properties exposed to subsidence on the East Coast
Median exposure estimate from the Virginia Tech and USGS East Coast analysis.
6 mm/yr
Average relative sea-level rise experienced by global coastal populations
Roughly twice the climate-driven absolute sea-level rise, 1995–2020.

Voices

Curated perspectives — historical figures and your fellow readers.

Ever wondered what historical figures would say about today's headlines?

Sign up to generate historical perspectives on this story.

People Involved

Organizations Involved

Timeline

April 2023 September 2026

4 events Latest: Today
Tap a bar to jump to that date
  1. National subsidence map: 71.5% of U.S. coast sinking

    Today Research

    Tufts University and Virginia Tech analysis of 190 million data points finds 71.5% of U.S. coastal areas subside faster than 1 mm/year, with the Gulf Coast fastest.

  2. 32-city flood risk analysis released

    Research

    Study of Atlantic, Pacific, and Gulf coast cities finds 24 of 32 are sinking more than 2 mm/year; half have areas sinking faster than sea levels rise.

  3. East Coast subsidence exposure study published

    Research

    Virginia Tech and USGS report over half of infrastructure in New York, Baltimore, and Norfolk sits on land sinking 1–2 mm/year, with at least 867,000 properties exposed.

  4. Atlantic coast marsh vulnerability quantified

    Research

    Nature Communications maps subsidence along the 3,500 km Atlantic coast and finds 58–100% of coastal marshes are losing elevation relative to sea level.

Scenarios

1

Congress funds coastal subsidence monitoring and adaptation

Possible Resolves by Q3 2027

Discussed by: Researchers at Virginia Tech and NASA, flood-risk analysts quoted in coverage of the studies

The 2026 national map gives federal and state agencies a concrete target. A coastal resilience bill would fund expanded vertical land motion monitoring, update flood maps to include subsidence rates, and direct money to retrofit levees and drainage in the fastest-sinking counties. Trigger would be a formal legislative package that names subsidence as a factor in flood planning.

2

Hardest-hit cities launch large-scale buyouts and retreat

Unlikely Resolves by Jan 1, 2028

Discussed by: Local officials in Charleston and Norfolk, flood-risk researchers cited in the studies

Cities already facing chronic tidal flooding begin buying out repeatedly flooded properties and moving infrastructure inland. Charleston, sinking about 4 mm/year and considering an 8-mile seawall, is the most watched case. A trigger would be a formal city program to purchase and demolish homes in subsidence-prone flood zones.

3

No policy response as nuisance flooding worsens

Possible Resolves by Q3 2027

Discussed by: No specific proponent — default scenario if current trajectory holds

Subsidence stays an overlooked factor. Flood maps continue to underestimate risk, infrastructure keeps sinking, and coastal counties experience more frequent clear-sky tidal flooding. The measurable signal would be rising nuisance flood days in the most affected cities with no new subsidence-specific policy in place.

Historical Context

3 moments from history that rhyme with this story — and how they unfolded.

August 2005

Hurricane Katrina and New Orleans (2005)

New Orleans sits mostly below sea level, and decades of subsidence — from drained wetlands and groundwater pumping — had lowered the city and weakened its levees. When Katrina struck, multiple levee failures flooded about 80% of the city and killed more than 1,800 people.

Then

The Army Corps of Engineers rebuilt and strengthened the levee system at a cost of roughly $14 billion.

Now

Katrina became the standard example of how sinking land reduces the effectiveness of flood defenses and magnifies storm damage.

Why this matters now

The new research explicitly cites Katrina as a case where subsidence reduced levee effectiveness. It grounds the abstract 71.5% figure in a known disaster and shows what ignoring vertical land motion can cost.

1920s–2021

Venice's centuries of subsidence and the MOSE barriers (2010s)

Venice sank roughly 10–15 centimeters over the 20th century from groundwater extraction and natural compaction, on top of a slowly rising Adriatic. Flooding of St. Mark's Square became routine. After decades of disputes, Italy completed the MOSE system of retractable sea barriers in 2020–2021.

Then

The barriers have held back high tides since activation, sharply reducing floods in the lagoon.

Now

Venice shows both the costs of subsidence and that engineered adaptation can work, but only with sustained investment and maintenance.

Why this matters now

Venice is the clearest international precedent for a city that measured its sinking and built infrastructure to counter it — the model U.S. cities like Charleston are weighing.

1980s–2024

Jakarta's groundwater-driven sinking and capital move (1980s–2024)

Unregulated groundwater extraction caused parts of Jakarta, Indonesia, to sink up to 25 centimeters per decade — among the fastest rates recorded anywhere. By 2019, sections of the city's sea wall had subsided below sea level, and flooding forced residents from their homes.

Then

Indonesia announced plans to move its capital to a new city on Borneo, with construction ongoing.

Now

Jakarta became the global cautionary tale of subsidence driven by human water use, showing that adaptation can fail when sinking outpaces defenses.

Why this matters now

Jakarta demonstrates that local, human-caused subsidence can be severe enough to force relocation, a possibility the U.S. research raises for fast-sinking counties.

Sources

(10)