Pull to refresh
Logo
First complete census of lower-48 glaciers finds a quarter already gone

First complete census of lower-48 glaciers finds a quarter already gone

New Capabilities

Total US glacier area and volume down about a third since the mid-20th century

Today: Comprehensive glacier loss analysis published in PNAS

Overview

Updated 1 hour ago

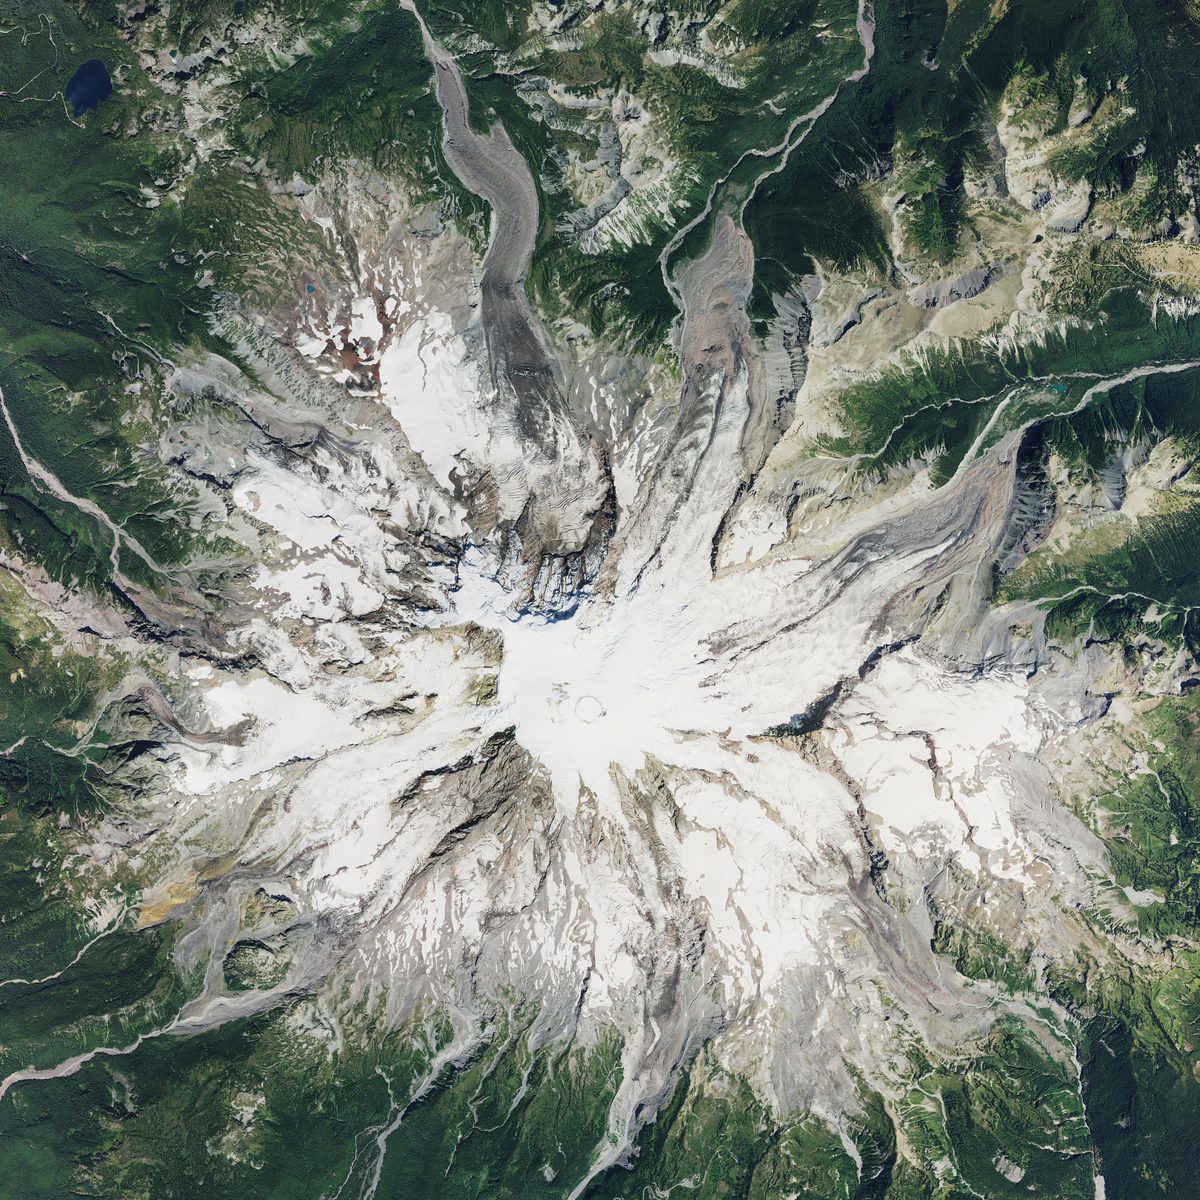
For the first time, researchers have counted and measured every glacier in the lower 48 states. The census, published in the Proceedings of the National Academy of Sciences (PNAS), shows 398 glaciers have vanished since the mid-20th century.

The remaining 1,331 glaciers hold about a third less area and a third less ice than in the 1950s. Glacier ice is a frozen reservoir: it melts during hot, dry periods and slows during cool, wet ones, smoothing streamflow when it matters most. As that reservoir shrinks, western watersheds lose the buffer.

Why it matters

Western watersheds lose their natural drought buffer as glaciers that release water during hot, dry periods keep shrinking.

Questions about this story

Free account needed to ask — your question is kept and asked for you right after sign-up. Answers are public.

0

I'm confused. If it was the first time that they've done this census, how could they know that it declined? That would imply that they had a baseline. What am I not understanding?

It was the first complete modern census, not the first ever—the baseline is the USGS topographic maps from the mid-1900s, which already showed these glaciers.

Why it matters: That baseline turns a suspicion into a hard number: a quarter of lower-48 glaciers are already gone.

  • USGS 1:24,000 topographic maps from the mid-20th century listed glaciers across the western U.S. and were the reference for glacier change for about 60 years.
  • For the new census, researchers first built a database of every glacier on those old maps, then used aerial and satellite imagery—mostly from 2015—to redraw their current outlines and compare.
  • The comparison found about a quarter of the glaciers have disappeared; overall glacier area and volume are down about one-third.
  • The new inventory of 1,331 glaciers, published in 2023, is an update of that older baseline, not a measurement with nothing to compare against.
AI-generated with web search — may be wrong. Check the linked sources.
Key Indicators

398
Glaciers vanished since mid-20th century
Gross loss reaches 398 after accounting for a few new glaciers formed by fragmentation.
35%
Total glacier area and volume lost
Both area and volume declined by about one-third since the USGS baseline mapping.
1,331
Glaciers remaining in the lower 48
Based on aerial imagery mostly collected in 2015.
195.29 km²
Glacier area lost since mid-20th century
Equivalent to roughly 27,000 soccer fields of ice gone.
5.53 gigatons
Ice volume lost since mid-20th century
Roughly 5.5 billion metric tonnes of ice melted away.
8% per decade
Current shrinkage rate in the western US
The long-term retreat rate documented from the 2015 baseline.

Voices

Curated perspectives — historical figures and your fellow readers.

Ever wondered what historical figures would say about today's headlines?

Sign up to generate historical perspectives on this story.

People Involved

Organizations Involved

Timeline

2015 mid-190

6 events Latest: Today
Tap a bar to jump to that date
  1. USGS maps establish glacier baseline

    Upcoming Baseline survey

    USGS 1:24,000 topographic maps inventory glaciers across the western US, becoming the reference for glacier change for 60 years.

  2. Comprehensive glacier loss analysis published in PNAS

    Today Study

    First complete census paired with the 1950s baseline finds 398 glaciers gone and area and volume down a third.

  3. Mass loss hits record pace

    Study

    USGS finds glaciers in western Canada and the conterminous US lost mass at twice the 2010-2020 rate during 2021-2024.

  4. Full inventory published in ESSD

    Publication

    Earth System Science Data publishes the census: 1,331 glaciers, 1,176 perennial snowfields, 35 buried-ice features.

  5. Updated glacier inventory released

    Data release

    Portland State University releases the updated inventory of glaciers and perennial snowfields.

  6. Aerial campaign photographs US glaciers

    Data collection

    National Agricultural Imagery Program aerial photos capture over 70% of the glacier outlines used in the new census.

Scenarios

1

Glacier loss accelerates after record 2021-2024 period

Likely Resolves by End of 2028

Discussed by: USGS 2025 study documenting doubled mass loss; PBS NewsHour reporting on 2030-2080 disappearance estimates

The 2021-2024 period saw mass loss at twice the prior decade's rate, driven by low winter snowpack, early heat waves, and wildfire debris darkening ice. If that acceleration holds, the next comprehensive survey would show area and volume declining faster than the historical 8% per decade. Researchers quoted by PBS put complete disappearance of lower-48 glaciers between 2030 and 2080 depending on winter conditions.

2

Shaded high-elevation glaciers stabilize in some locations

Possible Resolves by End of 2032

Discussed by: USGS analysis noting lower-48 glaciers are largely maintained by local topographic influences

Many surviving glaciers are small and sit in shaded cirques or high elevations where local conditions favor ice preservation. Avalanche snow, north-facing slopes, and cool canyon air could keep some ice alive even as regional cover declines. The next inventory would show a subset of glaciers in Washington, Montana, or Wyoming maintaining or gaining area.

3

Western water managers build storage to replace lost glacier buffering

Possible Resolves by End of 2028

Discussed by: Portland State researchers noting watersheds become more susceptible to drought as glacier buffering fades

Glaciers release water during hot, dry periods, smoothing seasonal streamflow. As that capacity fades, states in glacier-fed basins may pursue reservoirs, groundwater recharge, or other storage to replace the lost natural regulation. A major project approved or funded in the Columbia system, the Sierra Nevada, or the northern Rockies would mark this adaptation.

Historical Context

2 moments from history that rhyme with this story — and how they unfolded.

1950s-1960s

USGS topographic glacier maps (mid-1900s)

USGS field crews produced 1:24,000 scale topographic maps showing glaciers across the western US. These maps became the standard reference for glacier distribution and extent, even as the ice retreated over the following decades.

Then

The maps provided a detailed baseline of mid-20th century glacier extent across the lower 48.

Now

For 60 years they remained the only comprehensive glacier inventory of the conterminous US, growing increasingly outdated as glaciers retreated.

Why this matters now

The 2026 PNAS study compares today's glaciers against this mid-century baseline, using modern aerial imagery to quantify the change for the first time.

2021-2024

Unprecedented western North American glacier mass loss (2021-2024)

Glaciers in western Canada and the conterminous US lost mass at 22.2 gigatons per year on average over 2021-2024, about double the 2010-2020 rate, according to a USGS study. Low winter snowfall, early-season heat waves, and wildfire debris darkening the ice all contributed.

Then

Total ice volume in the region fell about 12% between 2020 and 2024.

Now

The acceleration suggests the long-term shrinkage documented by the new census could speed up, pulling forward estimates for when lower-48 glaciers disappear.

Why this matters now

This recent acceleration is the freshest data point on the same glaciers the census measured, showing the decline is not steady but accelerating.

Sources

(10)