


Pull to refresh
Logo
North American robot orders rise 24.8% on chip and auto-parts demand

North American robot orders rise 24.8% on chip and auto-parts demand

Money Moves Interactive

Semiconductor orders nearly doubled from a year earlier while food and consumer goods orders fell 23.7%.

Overview

Updated 1 hour ago

North American companies ordered 10,989 industrial robots in the third quarter of 2026, 24.8% more than a year earlier and the strongest quarter of the year. The orders were worth $723.5 million, up 26.1% from the same period in 2025.

The growth came from factories that make chips and car parts, not from the assembly lines that set the pace for four decades. Semiconductor and electronics orders rose 97.6% and auto-parts orders 90.4%, while automotive assembly orders grew only 7.5% and food and consumer goods orders fell 23.7%.

Why it matters

Robot orders are the earliest hard evidence that chip- and drug-industry factories are being fitted out to actually produce.

How it changed

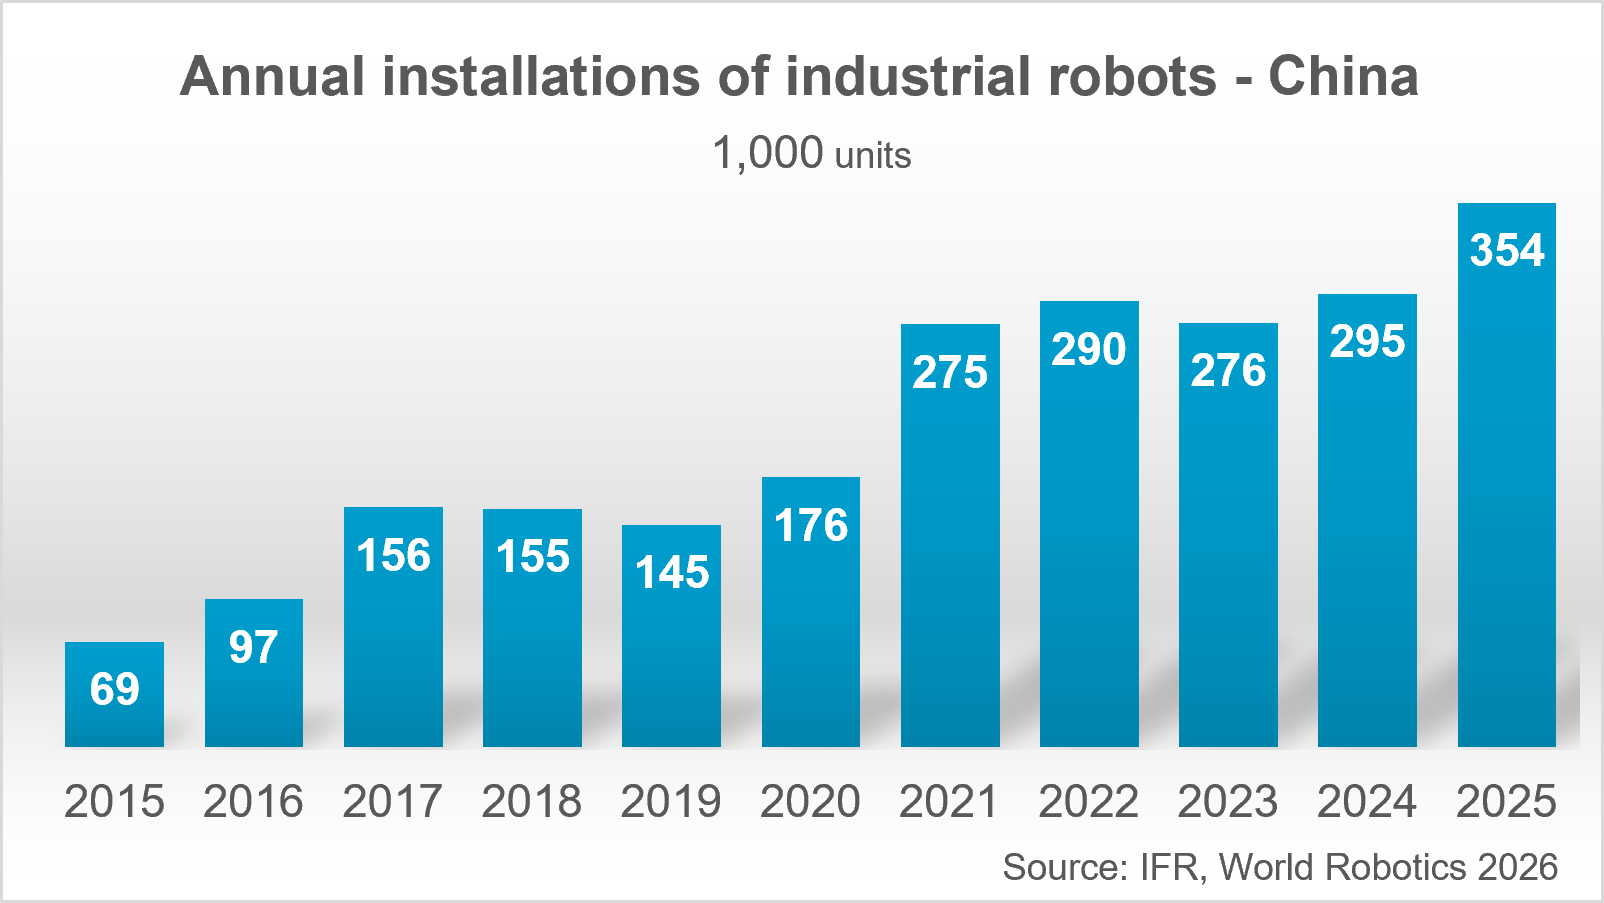
China now installs more factory robots than the rest of the world combined

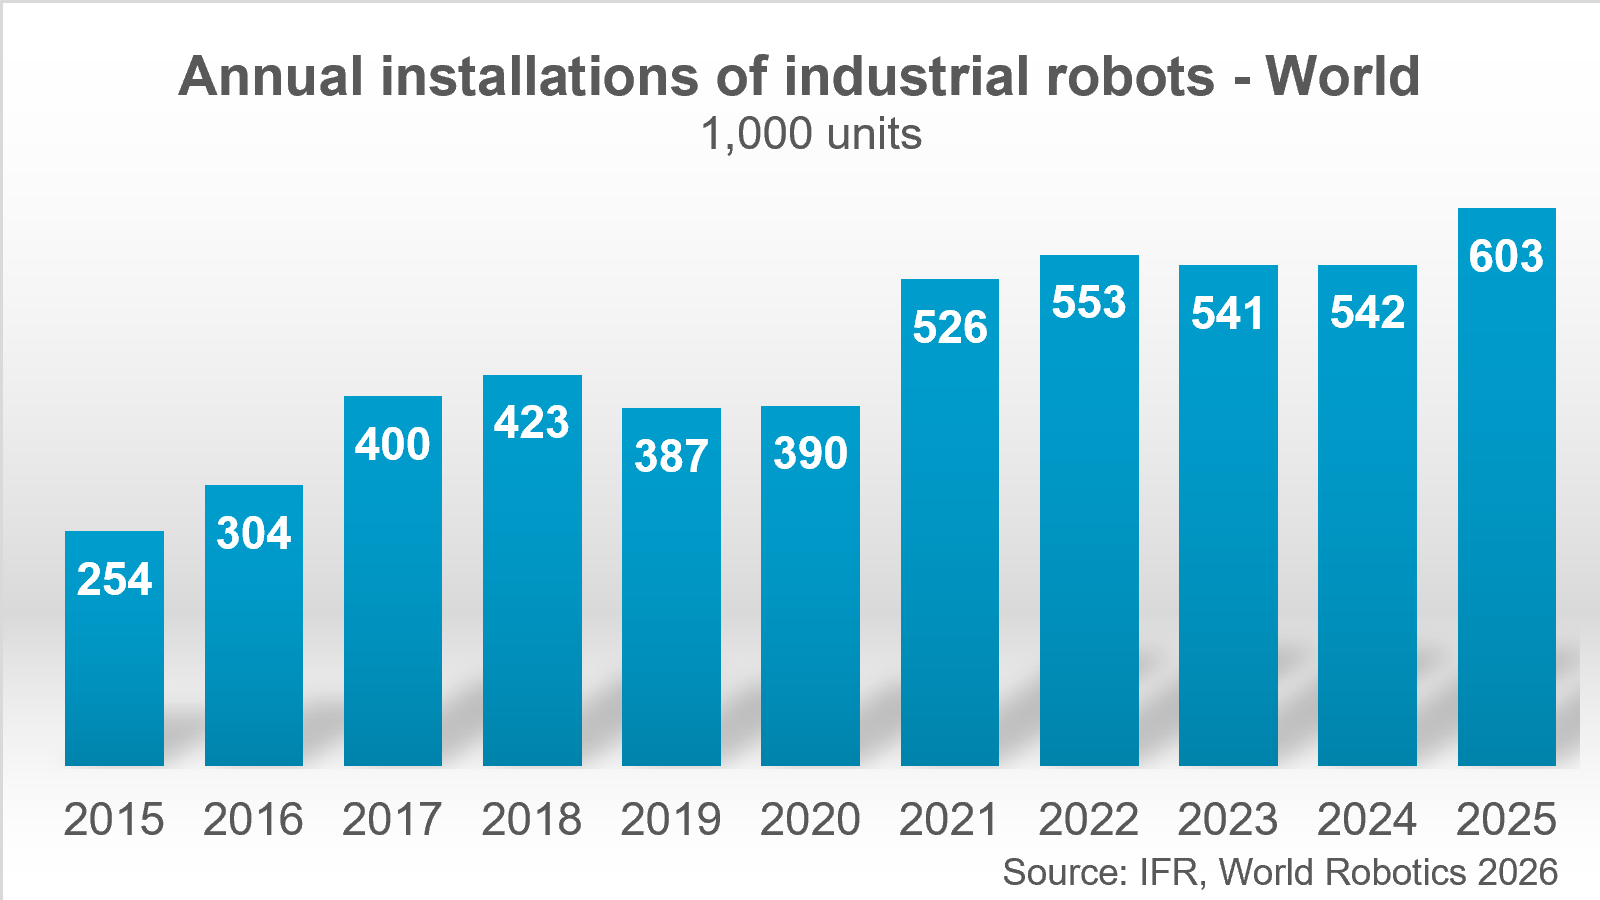
New factory robots installed each year, in thousands. In 2015 China took just over 1 in 4. In 2025 it took 59%, about nine for every one in the US. Press play.

China in 2025: 354k. Ranks 1 of 6.

A faded bar is the last survey, with its year. Bars only ever show real data points.

China now installs more factory robots than the rest of the world combined (k)
NameData pointsSource
China2015: 69; 2016: 97; 2017: 156; 2018: 155; 2019: 145; 2020: 176; 2021: 275; 2022: 290; 2023: 276; 2024: 295; 2025: 354IFR, World Robotics 2026 chart: China
All others2015: 64; 2016: 76; 2017: 104; 2018: 108; 2019: 104; 2020: 91; 2021: 112; 2022: 114; 2023: 122; 2024: 111; 2025: 120IFR, World Robotics 2026 chart: World
United States2015: 28; 2016: 31; 2017: 33; 2018: 40; 2019: 33; 2020: 31; 2021: 36; 2022: 40; 2023: 38; 2024: 34; 2025: 38IFR, World Robotics 2026 press conference slides 14, 17, 18
Japan2015: 35; 2016: 39; 2017: 46; 2018: 55; 2019: 50; 2020: 39; 2021: 46; 2022: 50; 2023: 46; 2024: 44; 2025: 36IFR, World Robotics 2026 press conference slides 14, 17, 18
South Korea2015: 38; 2016: 41; 2017: 40; 2018: 38; 2019: 33; 2020: 31; 2021: 31; 2022: 32; 2023: 31; 2024: 31; 2025: 30IFR, World Robotics 2024 press conference, Korea slide
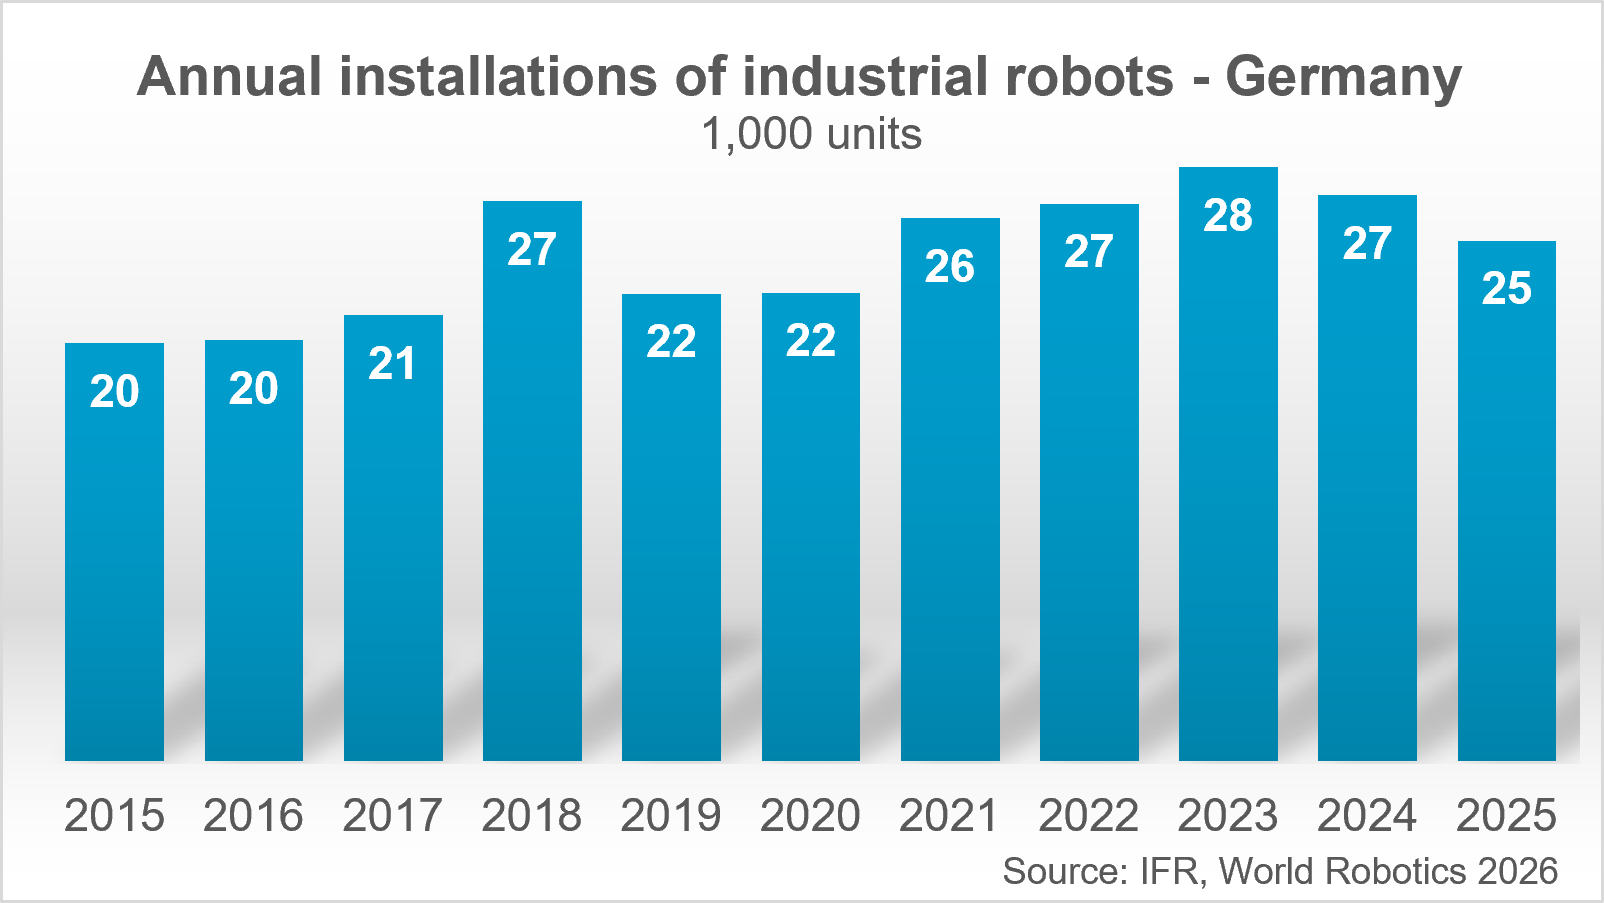
Germany2015: 20; 2016: 20; 2017: 21; 2018: 27; 2019: 22; 2020: 22; 2021: 26; 2022: 27; 2023: 28; 2024: 27; 2025: 25IFR, World Robotics 2026 chart: Germany

As of 2026-11-01. IFR counts robots installed, not orders as in this story. Rounded to thousands. South Korea 2015-23 is from the 2024 report, 2024 from the 2025 release; the rest from the 2026 report. All others is our sum: world minus the five named, so rounding can move it. Sources: IFR, World Robotics 2026 chart: China, IFR, World Robotics 2026 chart: World, IFR, World Robotics 2026 chart: Germany, IFR, World Robotics 2026 press conference slides 14, 17, 18, IFR, World Robotics 2024 press conference, Korea slide, IFR, World Robotics 2025 release (Korea 2024: 30,600).

Questions about this story

Free account needed to ask — your question is kept and asked for you right after sign-up. Answers are public.

No questions yet — be the first to ask.

Key Indicators

10,989
Q3 2026 robot orders
Units ordered by North American companies, the most in any quarter of 2026.
24.8%
Unit growth, year over year
Increase over the third quarter of 2025.
$723.5M
Order value
Total value of third-quarter orders, up 26.1% from a year earlier.
97.6%
Semiconductor and electronics growth
The fastest-growing industry category by units.
90.4%
Auto-parts supplier growth
Orders from automotive component manufacturers nearly doubled.
-23.7%
Food and consumer goods change
The only major category to shrink, after growing 18% in the second quarter.
16.7%
Collaborative robot share
Cobot orders rose 56% to 1,831 units, worth $63.8 million.

Voices

Curated perspectives — historical figures and your fellow readers.

Sign up to generate historical perspectives on this story.

People Involved

Organizations Involved

Timeline

August 2026 October 2026

4 events Latest: 2 days ago
Tap a bar to jump to that date
  1. Manufacturing Dive breaks out the gain by industry

    Latest Report

    Semiconductors rose 97.6%, auto components 90.4%, plastics and rubber 67.7%; food and consumer goods fell 23.7%.

  2. A3 reports 10,989 robot orders for the third quarter

    Data release

    Orders rose 24.8% in units and 26.1% in value over the prior year, the strongest quarter of 2026.

  3. Manufacturing expands for a ninth straight month

    Economic data

    The ISM manufacturing index read 54.5 in September, A3 noted, its ninth consecutive month above 50.

  4. A3's second-quarter release shows food orders up 18%

    Data release

    The association's Q2 report put food and consumer goods orders 18% higher than a year earlier. Automotive assembly orders were down over the first half.

Scenarios

1

Fourth-quarter orders beat the same quarter last year

Likely Resolves by Feb 15, 2027

Discussed by: A3's Q3 release and coverage in MillBrief and Manufacturing Dive

Semiconductor and life-sciences ordering has run ahead of auto assembly for three quarters. If it holds through December, 2026 ends with total orders above 2025. A pause in chip-fab fit-out or a wave of cancellations among auto-parts suppliers would break it.

2

Consumer-goods weakness drags total orders below last year

Unlikely Resolves by Feb 15, 2027

Discussed by: MillBrief's industry brief, which flagged the reversal in food and consumer goods

Food and consumer goods orders fell 23.7% after rising 18% the previous quarter, the segment most exposed to household demand. If that weakness spreads faster than chip and drug investment offsets it, the aggregate turns negative in the fourth quarter.

3

Food and consumer goods orders return to growth in 2027

Possible Resolves by Nov 15, 2027

Discussed by: A3 analysts and trade coverage tracking the category's swing

The category swung from plus 18% in the second quarter to minus 23.7% in the third, a move A3 attributed partly to the timing of large projects. A rebound in any 2027 quarter would show the drop was timing rather than a pullback in household-facing production.

Historical Context

3 moments from history that rhyme with this story — and how they unfolded.

1961

Unimate joins the General Motors line (1961)

General Motors installed Unimate, the first industrial robot, at a plant in Ewing Township, New Jersey, to handle hot die-cast parts. Inventors George Devol and Joseph Engelberger built the machine, which weighed two tons and moved on a programmed arm.

Then

The installation showed a robot could do dangerous, repetitive work at production speed.

Now

Car assembly became the industrial robot market's anchor customer for six decades.

Why this matters now

That anchor is why weak automotive assembly orders once meant a weak quarter for the whole market. In Q3 2026, automotive assembly grew only 7.5% and total orders rose 24.8% anyway.

1982-1988

Japanese automakers build U.S. plants (1982-1988)

Honda opened its Marysville, Ohio, plant in 1982, Nissan followed in Smyrna, Tennessee, in 1983, and the GM-Toyota joint venture NUMMI began building cars in Fremont, California, in 1984. All three were heavily automated from the start.

Then

The new plants set a benchmark for U.S. factory automation.

Now

They pushed domestic automakers toward robotics through the 1980s and 1990s.

Why this matters now

New plants, not retooled old ones, cluster robot orders. The current wave of chip and biopharma construction follows the same pattern in different industries.

2009

Detroit's bankruptcies and the capex freeze (2009)

U.S. auto sales collapsed in 2008. Chrysler filed for bankruptcy on April 30, 2009, and General Motors on June 1, 2009. Spending on plant equipment froze.

Then

Automaker robot orders fell sharply and took years to recover.

Now

The episode showed how deeply the North American robot market depended on one industry's investment cycle.

Why this matters now

A3's data show auto-assembly orders 17% below the prior year over the first nine months of 2026, yet total orders are up 9.6%.

Sources

(5)