Pull to refresh
Logo
Daily Brief
Following
Why Ranks Sign Up
US renewable power contracts hit record prices as policy and data center demand collide

US renewable power contracts hit record prices as policy and data center demand collide

Money Moves

Wind and solar power purchase agreements reach their highest levels since tracking began in 2018

April 14th, 2026: LevelTen Q1 2026 index: wind and solar PPAs hit record highs

Overview

For nearly a decade, wind and solar power kept getting cheaper. That streak has broken. As of the first quarter of 2026, the average US solar power purchase agreement costs $64.49 per megawatt-hour and the average wind contract costs $79.40 per megawatt-hour. Both are the highest figures LevelTen Energy has recorded since it began indexing the market in 2018, with wind prices up roughly 24 percent and solar up more than 13 percent year over year.

The rise does not reflect one cause. A July 2025 law accelerates the phase-out of federal tax credits that have underwritten renewable project economics for more than a decade. A January 2025 executive order paused federal permitting for onshore and offshore wind, slowing the pipeline of new projects.

Hyperscale data center operators are signing long-dated clean power contracts at unprecedented volume. Tight supply met surging demand under a shifting rulebook, and buyers are paying the difference.

Why it matters

Corporate renewable contracts set the floor price for clean electricity, and rising costs flow through to data centers, manufacturers, and eventually utility customers.

Questions about this story

No questions yet — be the first to ask.

Play on this story Voices Debate Predict

Key Indicators

$79.40/MWh
Average wind PPA price, Q1 2026
Highest level since LevelTen began indexing in 2018; up about 24 percent year over year.
$64.49/MWh
Average solar PPA price, Q1 2026
Up 4.6 percent from Q4 2025 and more than 13 percent year over year.
July 4, 2026
Tax credit construction deadline
Wind and solar projects must begin construction by this date under the One Big Beautiful Bill Act to retain full federal credits.
291
Q1 price offers indexed
From 207 projects across six North American power markets.
~1,050 TWh
Projected 2026 data center electricity demand
Would place data centers between Japan and Russia in global consumption rankings.

Voices

Curated perspectives — historical figures and your fellow readers.

Ever wondered what historical figures would say about today's headlines?

Sign up to generate historical perspectives on this story.

Play

Exploring all sides of a story is often best achieved with Play.

Log in to play. Track your picks, climb the leaderboards. Log in Sign Up
Predict 4 ways this could play out. Contrarian picks score more — points lock when the scenario resolves. Log in to play
Timeline Five events from this story — drag them oldest to newest. Log in to play
Connections Sixteen names from the news. Find the four hidden groups of four. Log in to play

People Involved

Organizations Involved

Timeline

August 2022 April 2026

6 events Latest: April 14th, 2026 · 1 month ago
Tap a bar to jump to that date
  1. LevelTen Q1 2026 index: wind and solar PPAs hit record highs

    Latest Market Data

    Solar contracts averaged $64.49 per MWh and wind averaged $79.40 per MWh, the highest since LevelTen began tracking in 2018. Solar rose 4.6 percent quarter over quarter; wind rose nearly 8 percent.

  2. Residential solar tax credit expires

    Policy

    The Section 25D credit, which reimbursed homeowners 30 percent of the cost of installing solar, ended at midnight under the new law.

  3. One Big Beautiful Bill Act becomes law

    Policy

    The law requires wind and solar projects to begin construction by July 4, 2026 or be placed in service by December 31, 2027 to claim federal tax credits, and terminates the residential solar credit at the end of 2025.

  4. Trump executive order pauses federal wind permitting

    Policy

    On inauguration day, President Trump directed federal agencies not to issue new approvals, rights of way, permits, leases, or loans for onshore or offshore wind projects pending a comprehensive review.

  5. Inflation Reduction Act signed, extending renewable tax credits

    Policy

    The law extended the 30 percent Investment Tax Credit and Production Tax Credit for wind and solar, locking in a decade of predictable incentive support that underwrote PPA pricing.

Historical Context

3 moments from history that rhyme with this story — and how they unfolded.

December 2015

Solar ITC cliff scare and rebound (2015)

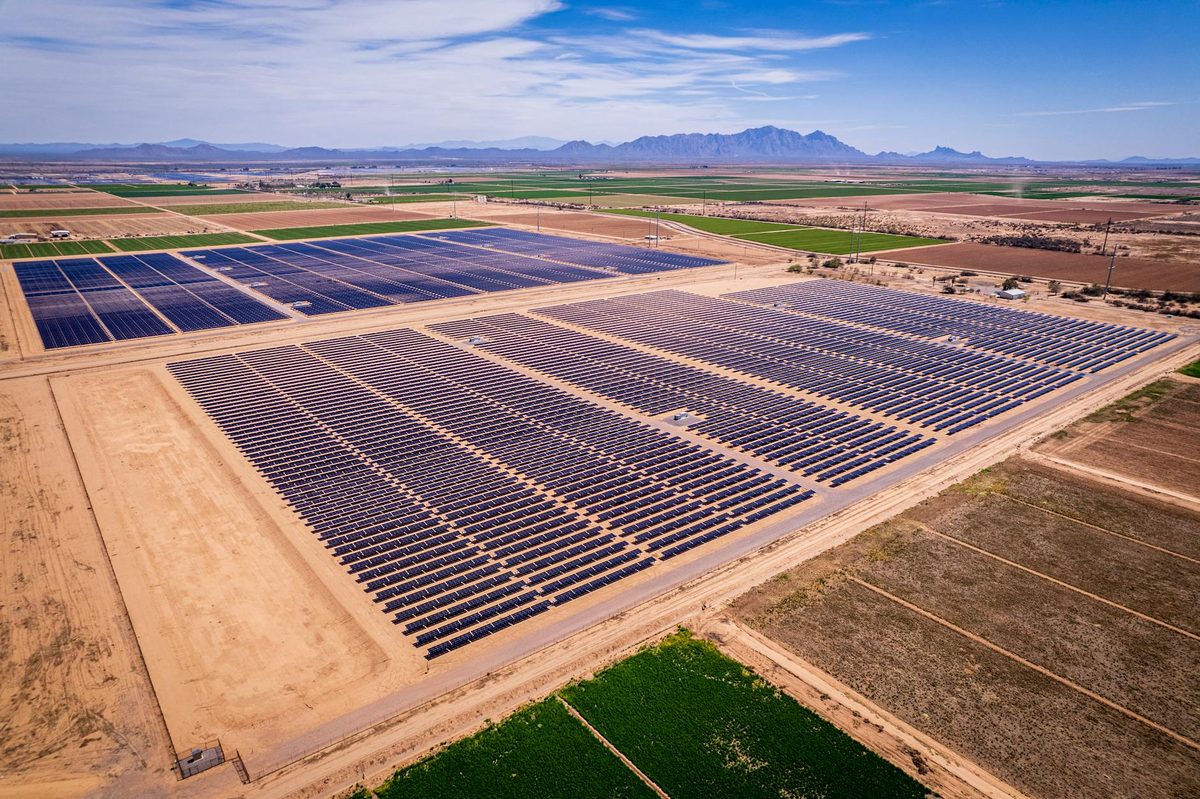
The 30 percent Solar Investment Tax Credit was scheduled to drop to 10 percent at the end of 2016. Developers rushed projects to qualify, pulling supply forward and creating a near-term price spike, until Congress extended the credit in the December 2015 omnibus bill.

Then

Signed PPA prices rose in late 2015 as buyers and developers scrambled to lock in terms ahead of the expected cliff.

Now

The extension unlocked a multi-year buildout that ultimately drove solar PPA prices to all-time lows by 2020.

Why this matters now

The current One Big Beautiful Bill Act construction deadline creates the same kind of cliff dynamic, with developers racing to qualify before July 4, 2026.

January 2012 to December 2014

Wind Production Tax Credit expiration cycles (2012-2014)

Congress repeatedly let the wind Production Tax Credit lapse and then renewed it, sometimes retroactively. Wind installations swung from 13 gigawatts in 2012 to just over 1 gigawatt in 2013 before partially recovering.

Then

Developers bunched project starts around expected expiration dates, creating boom-bust installation cycles and whipsawing PPA offers.

Now

The experience shaped how lenders, tax equity investors, and corporate buyers price policy risk into wind contracts, a playbook now being reactivated.

Why this matters now

Wind PPA buyers and sellers are again pricing tax policy risk into contracts, and the earlier cycles explain why wind is moving faster than solar in the current index.

2021 to mid-2022

Polysilicon and shipping crunch (2021-2022)

A global shortage of polysilicon, combined with container shipping costs that rose more than fivefold and new US tariffs on Southeast Asian solar imports, pushed US module prices up roughly 40 percent and ended a long run of falling solar PPA prices.

Then

Developers paused or repriced projects; some utility PPAs were renegotiated or canceled.

Now

The episode showed how quickly external shocks can reverse the cost declines that had made solar the cheapest new generation source on paper.

Why this matters now

The 2026 increase is more policy-driven than supply-chain-driven, but it again demonstrates that renewable prices are not monotonically downward.

Sources

(8)