In 2004, the world installed one gigawatt of solar power in a year. By 2025, that amount goes online every single day.
This pace pushed global capacity past 5,000 gigawatts by year-end, earning Science Magazine's 2025 Breakthrough of the Year. Solar and wind have eclipsed coal as the world's largest electricity source, while U.S. renewables supplied a record 25.7% of electricity in 2025. That's 1,162 terawatt-hours of U.S. renewable electricity, up 10% from 2024, with utility-scale solar climbing 34.5% and 53 gigawatts of new capacity added.
Solar costs 89% less than a decade ago, driving adoption in Africa (54% solar growth) and India (51.5% non-fossil capacity, met five years early). U.S. renewables and storage will dominate 99% of 2026 capacity additions despite new solar tariffs from India, Indonesia, and Laos.
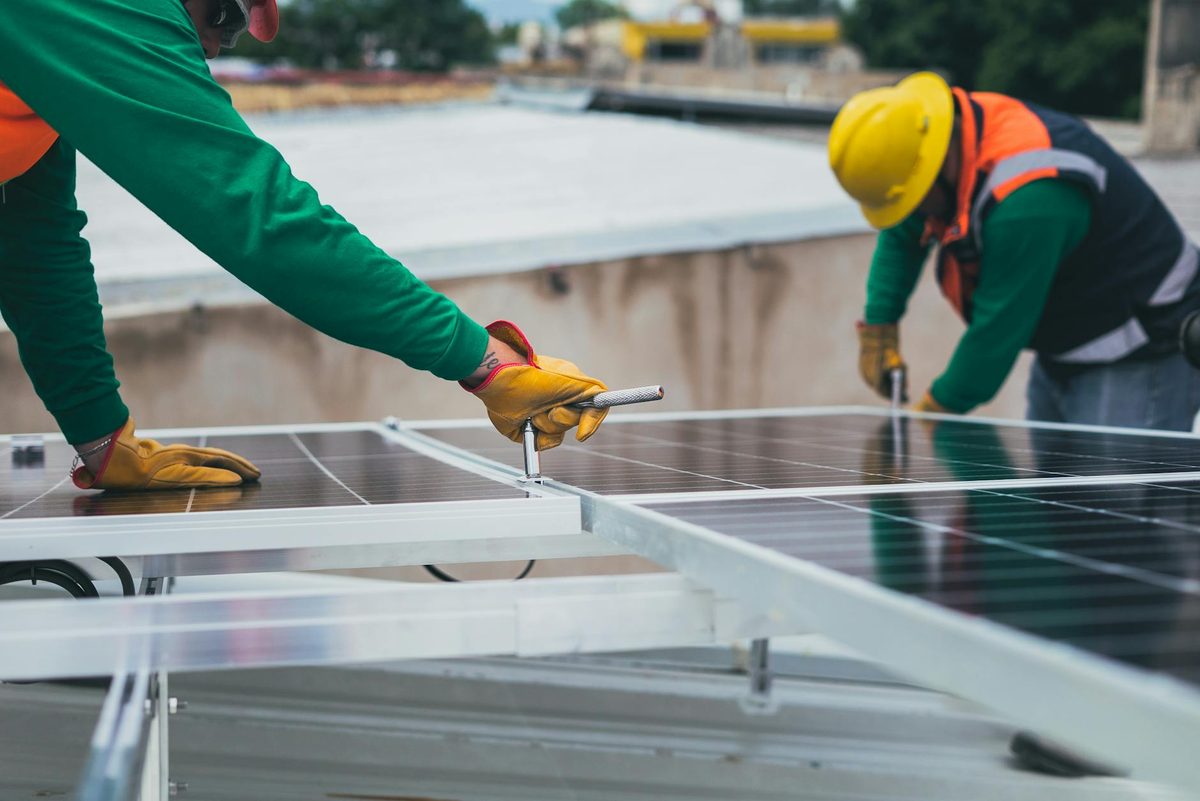
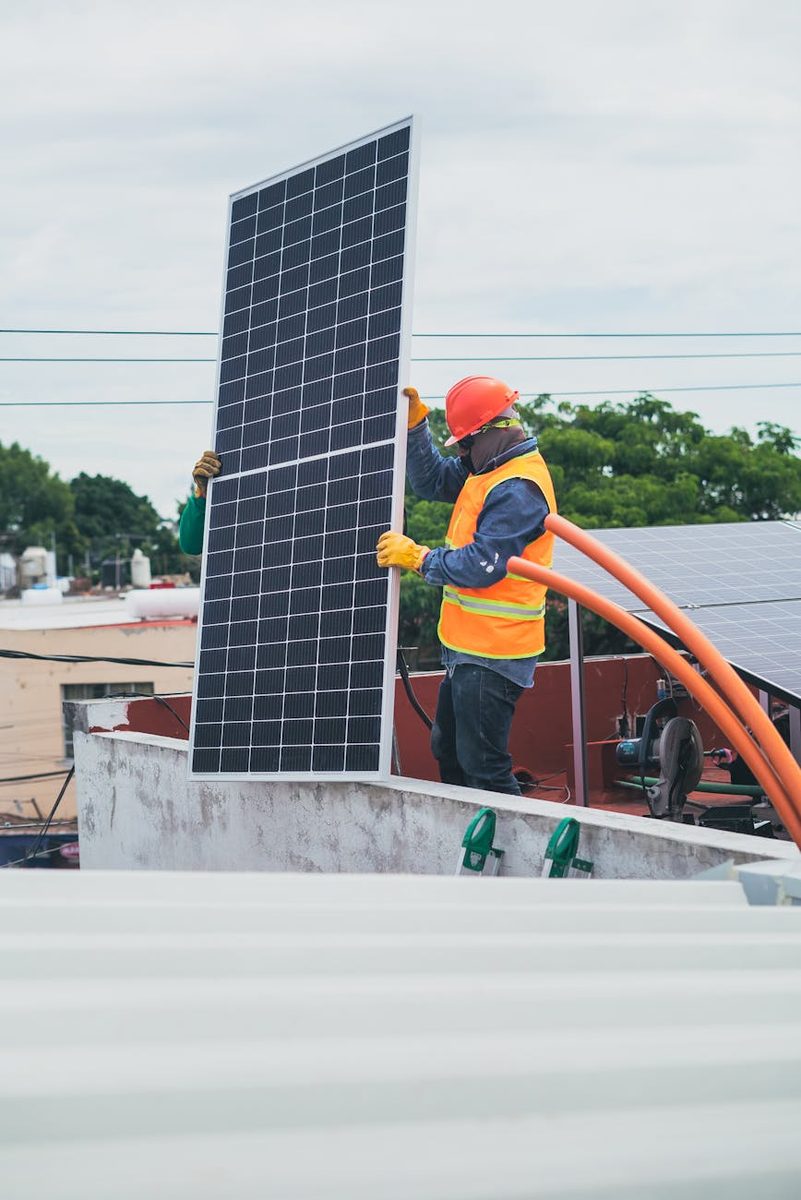
Images from Openverse under Creative Commons licenses.
Videos from YouTube.
Voices
Curated perspectives — historical figures and your fellow readers.
Oscar Wilde
(1854-1900) ·Victorian · wit
Fictional AI pastiche — not real quote.
"How delightful that humanity has finally discovered virtue becomes infinitely more fashionable when it costs nothing at all. We spent a century pretending to worship the sun as a deity of conscience, only to embrace it the moment we realized it was merely good business—proving once again that we are far too practical a species to ever be truly moral."
100% found this insightful
Ever wondered what historical figures would say about today's headlines?
Sign up to generate historical perspectives on this story.
19 events
Latest: February 27th, 2026 · 5 months ago
Showing 8 of 19
JK to step
Tap a bar to jump to that date
Jump to
February 2026
EIA Confirms Record U.S. Renewable Generation in 2025
LatestData
U.S. Energy Information Administration released final 2025 data showing renewables generated record 1,162 TWh (10% YoY), with utility-scale solar up 34.5%; 53 GW new renewable capacity added, largest since 2002. Natural gas output fell 3.3%.
U.S. Solar Tariff Decisions Imminent
Policy
Preliminary countervailing duty rates on solar cells and modules from India, Indonesia, and Laos expected end of February 2026, with preliminary anti-dumping duties due end of April. Rates expected to be prohibitive when combined.
China Revises 2026 Solar Forecast Downward
Forecast
China Photovoltaic Industry Association released revised forecast of 180-240 GW solar capacity additions for 2026, down from earlier 235 GW estimate, reflecting intense price competition and industry consolidation. CPIA expects average annual additions of 238-287 GW through 2030.
Global Clean Energy Deployment Accelerates Across Four Continents
Milestone
Australia achieved 50%+ renewable grid penetration in Q4 2025; Africa recorded 54% YoY solar growth; EU wind+solar reached 30% of generation; India hit 51.5% non-fossil capacity five years ahead of target. China added 543 GW total capacity in 2025.
China Forecast to Add 235 GW Solar in 2026
Forecast
China expected to commission 235 GW of solar PV and 98 GW of wind capacity in 2026, continuing its dominance in global renewable deployment and pushing total global renewable additions higher.
January 2026
U.S. Renewables Set to Dominate 2026 Capacity Additions
Milestone
U.S. Energy Information Administration projects renewables and battery storage will account for 99.2% of net new generating capacity in 2026, with solar and wind combined reaching 21% of U.S. electricity generation by 2027.
IRENA Plans Fossil Fuel Transition Roadmap
Policy
International Renewable Energy Agency preparing comprehensive strategy to phase out fossil fuels globally, to be presented at COP31 leadership meetings.
Global Renewable Capacity Surpasses 5,000 GW
Milestone
World reaches over 5,000 GW of installed renewable power capacity by end of 2025, with additions only needing to rise 12% annually through 2030 to meet global tripling targets.
December 2025
Science Names Renewable Surge 2025 Breakthrough
Recognition
Science Magazine selected the growth of renewable energy as its annual Breakthrough of the Year, citing the sector's shift from virtue-driven adoption to economic inevitability.
July 2025
Renewables Overtake Coal Globally
Milestone
For the first time in history, renewable sources generated more electricity than coal worldwide, with renewables reaching 34.3% of global generation versus coal's 33.1%.
May 2025
China Exceeds 1 Terawatt of Solar Capacity
Milestone
China became the first country to surpass one terawatt of installed solar power, a capacity equivalent to roughly 1,000 nuclear reactors.
January 2025
India Crosses 100 GW Solar Threshold
Milestone
India's installed solar capacity surpassed 100 gigawatts, with the country adding nearly 35 GW in 2025 alone—a 41% year-over-year increase.
March 2024
China's Emissions Begin 18-Month Plateau
Climate
China's carbon dioxide emissions flattened or declined, a trend that would continue for 18 months as renewable deployment outpaced electricity demand growth.
January 2024
Global Solar Installations Hit 585 GW Record
Milestone
The world installed a record 585 gigawatts of new solar capacity in 2024, 30% more than 2023 and more than double the 2022 figure.
January 2019
Denmark Exceeds 50% Wind Power
Milestone
Denmark became the first country to generate more than half its electricity from wind, demonstrating that high renewable penetration was technically feasible.
January 2010
Solar Cost Baseline Established
Milestone
Residential solar installations cost roughly $8.70 per watt; utility-scale systems around $7.50 per watt, setting the baseline for subsequent price declines.
April 2000
Germany Enacts Renewable Energy Act
Policy
Germany's Erneuerbare-Energien-Gesetz established feed-in tariffs guaranteeing prices for renewable electricity, accelerating solar and wind deployment.
January 1979
First Modern Wind Turbine Launched
Technology
Danish company Vestas released its V10-30kW model, launching the modern wind power industry.
October 1973
Arab Oil Embargo Sparks Energy Crisis
Origin
The Organization of Arab Petroleum Exporting Countries declared an oil embargo, triggering the first modern energy crisis and catalyzing government investment in alternative energy research.
Historical Context
3 moments from history that rhyme with this story — and how they unfolded.
1 of 3
October 1973 - March 1974
1973 Oil Embargo
Arab oil-exporting nations imposed an embargo on the United States and other countries supporting Israel in the Yom Kippur War. Oil prices quadrupled, gas lines stretched for blocks, and industrialized economies faced their first modern energy crisis.
Then
The embargo catalyzed the creation of the International Energy Agency in 1974 and prompted governments to fund alternative energy research.
Now
It planted the seeds of the modern renewable energy industry, though fossil fuel abundance in the 1980s-90s delayed widespread adoption by decades.
Why this matters now
Today's renewable surge completes a 52-year arc that began with the oil crisis—except now economics, not crisis response, drives adoption.
2 of 3
April 2000 - present
Germany's Energiewende (2000-present)
Germany enacted the Renewable Energy Act, guaranteeing fixed prices for solar and wind electricity. The policy triggered a boom in distributed generation, with citizens and cooperatives rather than utilities leading deployment. By 2020, renewables supplied over 40% of German electricity.
Then
Electricity prices rose significantly for consumers, drawing criticism, but renewable costs plummeted as German demand created global manufacturing scale.
Now
Germany's subsidy-driven market creation is credited with driving the 89% solar cost decline that now makes renewables economically competitive worldwide.
Why this matters now
The current global transition is reaping the benefits of Germany's early, expensive investments—today's cheap solar exists because Germany paid premium prices 15 years ago.
3 of 3
1979 - 2019
Denmark's Wind Power Breakthrough (1979-2019)
Following the oil crisis, Denmark invested heavily in wind power, with Vestas launching the modern wind turbine industry in 1979. By 2019, Denmark became the first country where wind generated more than 50% of electricity.
Then
Denmark created a world-leading wind industry and dramatically reduced fossil fuel dependence.
Now
Danish success demonstrated that high renewable penetration was technically achievable, influencing other nations' ambitions.
Why this matters now
Denmark's path showed that renewable-majority grids were possible—a proof of concept that informed the IEA's current projections of 50% global renewable share by 2030.