The United States economy grew at an annualized rate of just 1.4% in the final quarter of 2025—a steep drop from 4.4% the quarter before and well below the 2.5% that forecasters expected. The Bureau of Economic Analysis (BEA) estimates that the 43-day government shutdown, the longest in American history, subtracted roughly one full percentage point from growth by itself. Federal spending fell at a 16.6% annualized rate during the quarter, dragging headline output down by more than a percentage point even as consumer spending and business investment continued to expand.
The report compounds a difficult picture for policymakers. Inflation, as measured by the personal consumption expenditures (PCE) price index the Federal Reserve watches most closely, rose to 2.9%—still well above the Fed's 2% target. That combination of weakening growth and sticky prices narrows the Fed's room to cut interest rates, even as markets push for relief. 
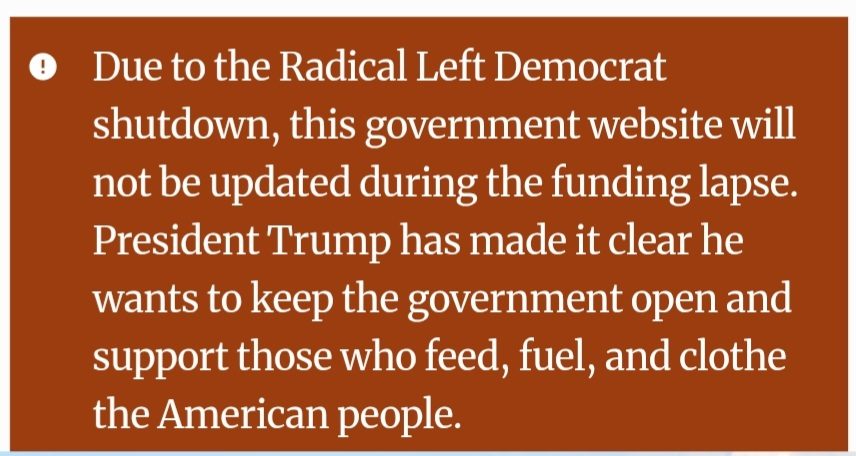
The data release itself was delayed three weeks—from January 29 to February 20—because the shutdown disrupted the BEA's own data-collection operations, meaning investors and the Fed were flying partially blind during a critical stretch.
Images from Openverse under Creative Commons licenses.
Videos from YouTube.
Interactive
Exploring all sides of a story is often best achieved with
Play.
Ayn Rand
(1905-1982) ·Cold War · philosophy
Fictional AI pastiche — not real quote.
"How deliciously instructive: when the government shuts down, consumers and businesses *expand* — and only when Washington resumes its "essential" functions does anyone claim to notice the wound. The shutdown did not subtract from the economy; it merely made visible what the spending had been concealing."
0% found this insightful
Ever wondered what historical figures would say about today's headlines?
Sign up to generate historical perspectives on this story.
Click a figure to generate their perspective on this story
Debate Arena
Two rounds, two personas, one winner. You set the crossfire.
Choose Your Battle
Watch two AI personas debate this story using real evidence
Make predictions and set the crossfire to earn XP and cred
Select Your Champions
Choose one persona for each side of the debate
DEBATE TOPIC
SIDE A (PRO)
Select debater for this side:
✓
SIDE B (CON)
Select debater for this side:
✓
Choose personas with different perspectives for a more dynamic debate
VS
Get ready to make your prediction...
Round of
Claim
Evidence
Stakes
Crossfire Answer
Closing Statement
Claim
Evidence
Stakes
Crossfire Answer
Closing Statement
Your Crossfire Question
Generating arguments...
Who's Got This Round?
Make your prediction before the referee scores
Correct predictions earn +20 XP
Evidence
40%
Logic
30%
Detail
20%
Style
10%
Round Results
Your Pick!
+20 XP
Your Pick
Not this time
Evidence (40%)
Logic (30%)
Detail (20%)
Style (10%)
Overall Score
/10
Your Pick!
+20 XP
Your Pick
Not this time
Evidence (40%)
Logic (30%)
Detail (20%)
Style (10%)
Overall Score
/10
Set the Crossfire
Pick the question both personas must answer in the final round
Crafting crossfire questions...
Choosing a question earns +10 XP crossfire bonus
🏆
Total XP Earned
Cred Change
Predictions
Debate Oracle! You called every round!
Sharp Instincts! You know your debaters!
The Coin Flip Strategist! Perfectly balanced!
The Contrarian! Bold predictions!
Inverse Genius! Try betting the opposite next time!
XP Breakdown
Base completion+20 XP
Rounds played ( rounds x 5 XP)
+ XP
Correct predictions ( correct x 20 XP)
+ XP
Crossfire bonus+10 XP
Accuracy
%
Prediction History
Round
You picked:
✓✗
Keep debating to level up your credibility and unlock achievements
Who Said What?
WHO SAID WHAT?
Can you match the quotes to the right people?
Rounds
People
Score:
Round /
streak
-- ?
Score:
Round /
streak
Next Up
Round
of
points
Correct
Best Streak
Time Bonus
People Involved
Jerome Powell
Chair, Federal Reserve (Navigating tension between weak growth data and persistent inflation)
Donald Trump
President of the United States (Blaming Democrats and the Federal Reserve for weak GDP numbers)
Organizations Involved
BU
Bureau of Economic Analysis (BEA)
Federal statistical agency
Status: Released delayed Q4 GDP report; subsequent releases also rescheduled
The Commerce Department agency responsible for producing the official gross domestic product estimates and other national economic statistics.
CO
Congressional Budget Office (CBO)
Federal legislative agency
Status: Published shutdown economic impact analysis
The nonpartisan federal agency that provides economic and budgetary analysis to Congress.
BO
Board of Governors of the Federal Reserve System
Central bank
Status: On hold after three rate cuts, facing conflicting growth and inflation signals
The US central bank responsible for setting monetary policy, including the federal funds rate that influences borrowing costs throughout the economy.
Timeline
Trump Posts About Weak GDP Before Official Release
Political
President Trump writes on Truth Social that "The Democrat Shutdown cost the U.S.A. at least two points in GDP" and calls for lower interest rates, 40 minutes before the BEA's 8:30 a.m. publication.
Q4 GDP Comes In at 1.4%, Far Below Forecasts
Economic Data
The BEA reports fourth-quarter growth of 1.4%, missing the 2.5% consensus by more than a full percentage point. The shutdown subtracted an estimated 1.0 point; core PCE inflation rose to 3.0%.
Fed Pauses Rate Cuts
Monetary Policy
The Federal Reserve holds rates steady at 3.5%–3.75%. Two governors dissent, favoring a cut. Powell says the economy is on "firm footing" but acknowledges quarterly GDP is "lumpy."
BEA Announces Cascading Release Delays
Administrative
The BEA formally reschedules the Q4 GDP advance estimate from January 29 to February 20, with subsequent releases also pushed back through April.
Q3 2025 GDP: 4.4% Growth
Economic Data
The BEA releases its delayed initial estimate for Q3, showing robust 4.4% annualized growth—the last quarter unaffected by the shutdown.
Fed Delivers Third Consecutive Rate Cut
Monetary Policy
The Federal Reserve cuts rates by 25 basis points to 3.5%–3.75%, though internal divisions over the decision signal a potential pause ahead.
43-Day Shutdown Ends
Fiscal Policy
President Trump signs a continuing resolution funding the government through January 30, 2026, ending the longest shutdown in US history. The bill includes reversal of federal employee firings and full SNAP funding through September 2026.
CBO Models Three Shutdown Scenarios
Analysis
The CBO estimates the shutdown has already cost $18 billion in lost output and projects permanent losses of $7–14 billion depending on duration.
USDA Announces No November SNAP Benefits
Policy Impact
The Department of Agriculture announces that Supplemental Nutrition Assistance Program benefits for 42 million Americans will not be issued for November due to the shutdown.
Government Shutdown Begins
Fiscal Policy
The federal government shuts down after Senate Democrats block a House-passed continuing resolution. Approximately 670,000 federal workers are furloughed and 730,000 are required to work without pay.
CBO Warns of Shutdown Economic Costs
Analysis
The Congressional Budget Office publishes a pre-shutdown analysis estimating a funding lapse could reduce Q4 GDP growth by up to 2 percentage points.
Fed Begins Rate-Cutting Cycle
Monetary Policy
The Federal Reserve cuts the federal funds rate by 50 basis points, its first reduction in this cycle, citing a cooling labor market.
Q2 2025 GDP Rebounds to 3.8%
Economic Data
Growth accelerates sharply in the second quarter, driven by consumer spending and business investment.
Q1 2025 GDP Shows Contraction
Economic Data
The BEA reports the US economy contracted at an annualized rate of 0.3% in Q1 2025, later revised to -0.5%. Increased imports and reduced government spending drive the decline.
Scenarios
1
Q1 2026 Rebound Erases Shutdown Drag, Fed Stays on Hold
Discussed by: Congressional Budget Office, Goldman Sachs Research, Morgan Stanley
The CBO projected that the first quarter of 2026 would see a GDP growth boost of roughly 2.2 percentage points as federal spending resumes and back-pay reaches workers. If this rebound materializes, Q1 growth could reach 3–4%, and the Fed would have cover to maintain its pause. Inflation staying above target reinforces the hold. This is the baseline scenario most analysts are working with—a statistical pothole, not a structural break.
2
Weak Growth Persists, Fed Forced Into Cuts Despite Sticky Inflation
If the Q4 weakness reflects more than just the shutdown—if consumer spending continues to soften and job growth remains tepid—the Fed faces a genuine dilemma. Cutting rates while inflation sits at 3% risks undermining credibility, but holding too long risks tipping the economy into contraction. J.P. Morgan has flagged this "stagflation lite" scenario, where the Fed is forced to prioritize the growth side of its dual mandate. Markets are currently pricing in at most two cuts in 2026, suggesting some probability is being assigned to this path.
3
Another Funding Lapse Compounds Economic Uncertainty
Discussed by: Committee for a Responsible Federal Budget, Brookings Institution
The continuing resolution that ended the shutdown only funds the government through January 30, 2026, and subsequent stopgap measures have not resolved the underlying appropriations standoff. Trump's own Truth Social post warned that Democrats are pursuing another shutdown "in mini form." A second funding lapse in 2026 would extend the data disruption at the BEA and other statistical agencies, compound federal contractor losses that the CBO says are never fully recovered, and further erode consumer and business confidence. The 2025 shutdown already destroyed an estimated $11 billion in permanent economic output.
4
Tariff Uncertainty and Inflation Push Economy Toward Recession
Discussed by: Stanford Institute for Economic Policy Research, Rabobank, US News recession watch analysts
The Q4 GDP miss coincided with a major Supreme Court ruling striking down President Trump's emergency tariffs. If new trade measures are reimposed through different legal authority, the combination of tariff-driven price increases, persistent core inflation at 3%, and a labor market that added fewer jobs in 2025 than any non-recession year in decades could push the economy into a technical recession. Recession probability estimates have fallen from 40% to 30% but remain elevated. This scenario turns the GDP miss from a one-quarter anomaly into the leading edge of a downturn.
Historical Context
2018–2019 Government Shutdown (35 Days)
December 2018 – January 2019
What Happened
A 35-day partial shutdown over border wall funding—then the longest in US history—furloughed roughly 380,000 federal workers. The CBO estimated it reduced Q4 2018 GDP by 0.1 percentage points and Q1 2019 GDP by 0.2 points, permanently destroying $3 billion in output.
Outcome
Short Term
GDP rebounded quickly once government reopened. The economy grew 3.1% in Q1 2019 after the shutdown ended, as federal spending and back-pay flowed through.
Long Term
The episode established a template: shutdowns create a visible GDP drag followed by a mechanical rebound, with a small but permanent loss. It also showed that financial markets largely shrug off shutdowns, treating them as temporary noise.
Why It's Relevant Today
The 2025 shutdown was eight days longer, affected more workers (670,000 furloughed versus 380,000), and hit during a full quarter rather than spanning two. Its estimated 1.0 percentage point GDP drag dwarfs the 2018–2019 impact, suggesting the damage scales non-linearly with duration and breadth.
2013 Government Shutdown (16 Days)
October 2013
What Happened
A 16-day shutdown over Affordable Care Act funding furloughed about 800,000 federal employees. The CBO estimated it subtracted 0.3 percentage points from Q4 2013 annualized GDP growth and permanently reduced output by $2 billion.
Outcome
Short Term
The economy bounced back in Q4 2013 with 3.8% growth. Standard & Poor's estimated the shutdown cost the economy $24 billion when including broader ripple effects on consumer and business confidence.
Long Term
The 2013 episode, combined with sequestration budget cuts, contributed to a broader narrative about fiscal brinksmanship damaging US economic credibility. It helped catalyze the Bipartisan Budget Act of 2013, which temporarily eased spending caps.
Why It's Relevant Today
The 2013 shutdown was less than half as long as the 2025 episode but still measurably dented growth and eroded confidence. The pattern of a short-term statistical distortion masking real permanent losses—estimated by the CBO at $11 billion for 2025—is consistent across all three episodes.
Q1 2014 GDP Shock (Polar Vortex)
January – March 2014
What Happened
The US economy contracted by 2.1% in Q1 2014, shocking markets that had expected modest growth. The extreme "polar vortex" winter was blamed for suppressing construction, retail, and transportation activity. Initial reports triggered recession fears before revised data and a strong Q2 rebound calmed markets.
Outcome
Short Term
GDP surged to 5.0% in Q2 2014 as pent-up demand was released. Markets quickly reclassified the Q1 number as weather-driven noise rather than a fundamental shift.
Long Term
The episode became a case study in how one-off disruptions—weather, shutdowns, inventory swings—can produce dramatic quarterly GDP figures that do not reflect underlying economic health. It reinforced the practice of looking at multi-quarter averages.
Why It's Relevant Today
The Q4 2025 GDP miss is structurally similar: a known external disruption (shutdown instead of weather) producing a dramatic single-quarter deceleration. The key question is whether, like 2014, the rebound will be swift and complete—or whether underlying weakness in consumer spending and persistent inflation make this quarter different.