

Pull to refresh
Logo
Global warming has accelerated since 2015, study finds

Global warming has accelerated since 2015, study finds

Built World

Warming rate nearly doubled to about 0.35°C per decade, with 98% confidence across five datasets

Overview

Updated 1 hour ago

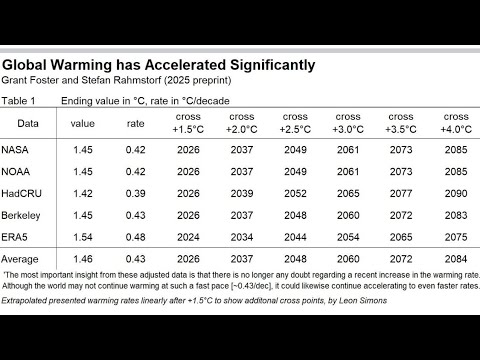
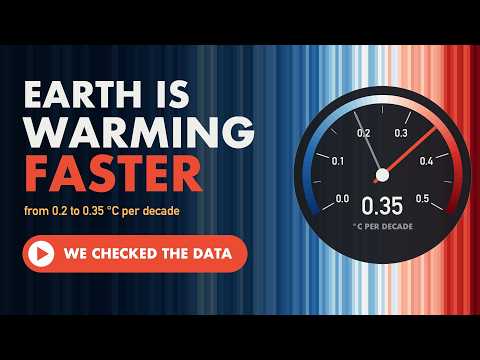
The planet warmed about 0.35°C per decade over the past ten years, nearly twice the pace from 1970 to 2015. A study published this week is the first to show that increase is statistically real, not an artifact of El Niño or a few hot years.

If the rate holds, the 1.5°C threshold in the Paris Agreement arrives years earlier than projected in 2015. The finding also sharpens a dispute among climate scientists about how much of the recent heat is human-caused and how much is natural variation.

Why it matters

A faster warming rate moves the 1.5°C deadline years closer and changes how quickly countries must cut emissions.

Questions about this story

Free account needed to ask — your question is kept and asked for you right after sign-up. Answers are public.

No questions yet — be the first to ask.

Key Indicators

0.35°C per decade
Recent warming rate
Average global surface warming over the past decade, roughly 2015-2025.
0.2°C per decade
1970-2015 warming rate
The average pace over the four and a half decades before the acceleration.
98%
Statistical confidence
Confidence that the acceleration is real after adjusting for natural variability.
5
Independent datasets
NASA, NOAA, HadCRUT, Berkeley Earth and ERA5 all show the acceleration.
1.44°C
Current warming above preindustrial
Copernicus estimate of the global average in 2026.

Voices

Curated perspectives — historical figures and your fellow readers.

Sign up to generate historical perspectives on this story.

People Involved

Organizations Involved

Timeline

December 2015 October 2026

4 events Latest: 4 days ago
Tap a bar to jump to that date
  1. Study finds warming accelerated since 2015

    Latest Study

    PIK researchers report a warming rate of about 0.35°C per decade, nearly double the 1970-2015 pace, with 98% confidence.

  2. Copernicus moves 1.5°C projection to 2029

    Projection

    The service says the threshold is now about three years away, versus 27 years in 2015.

  3. 2023 and 2024 become the hottest years on record

    Climate record

    Both years set global temperature records, partly because of El Niño and a solar maximum.

  4. Paris Agreement sets 1.5°C goal

    Treaty

    Countries adopt the Paris Agreement, aiming to limit warming to 1.5°C above preindustrial levels.

Scenarios

1

Warming rate holds near 0.35°C per decade through 2030

Possible Resolves by Jan 1, 2031

Discussed by: Potsdam Institute researchers and Carbon Brief

If the adjusted trend persists, independent datasets will show the 2025-2030 warming rate staying well above the 1970-2015 average. That would confirm the acceleration is a lasting shift, not a short-term fluctuation.

2

Acceleration proves temporary as rate falls back toward 0.2°C per decade

Unlikely Resolves by Jan 1, 2031

Discussed by: Climate scientist Beaulieu and other researchers cited by Carbon Brief

Natural variability or a pause in emissions growth could slow the measured rate. Beaulieu said continued monitoring is needed to know whether the acceleration lasts.

3

1.5°C long-term threshold formally breached before 2035

Possible Resolves by Jan 1, 2036

Discussed by: Copernicus Climate Change Service and Carbon Brief

A single hot year does not breach the Paris Agreement, which refers to long-term warming. If the accelerated rate continues, the 20-year average could cross 1.5°C within a decade.

Historical Context

3 moments from history that rhyme with this story — and how they unfolded.

1998-2013

The global warming 'hiatus' debate (1998-2013)

Global average surface temperatures rose more slowly than in the 1980s and 1990s, prompting claims that warming had paused. Later research attributed much of the slowdown to La Niña, a solar minimum, volcanic aerosols and heat uptake by the oceans.

Then

The apparent pause became a political talking point and a test case for climate models.

Now

Scientists improved methods for separating natural variability from the human-caused trend, the same problem the 2026 study addresses.

Why this matters now

The hiatus showed how natural swings can hide or mimic changes in the warming rate. The new study tries to strip those swings out before testing for acceleration.

1958

Keeling Curve begins continuous CO2 monitoring (1958)

Charles Keeling began measuring atmospheric carbon dioxide at Mauna Loa, Hawaii. The record showed CO2 rising steadily year after year, with a sawtooth seasonal pattern.

Then

The measurements gave the first clear, continuous evidence of rising CO2.

Now

The Keeling Curve became the backbone of climate monitoring and a model for long-term environmental records.

Why this matters now

It shows why long, carefully calibrated records matter: short windows can mislead, while decades of data reveal the trend.

December 2015

Paris Agreement adopted (2015)

At COP21 in Paris, countries agreed to hold warming well below 2°C and pursue efforts to limit it to 1.5°C above preindustrial levels.

Then

The 1.5°C goal became the benchmark for climate policy and activism.

Now

Projections of when 1.5°C would be reached became a way to measure progress, or its absence.

Why this matters now

The 2026 study measures acceleration against the 1.5°C goal, and Copernicus now projects the threshold arriving in 2029 rather than 2045.

Sources

(5)