Pull to refresh
Logo
Daily Brief
Following
Why
The great convergence: global income inequality reverses course

The great convergence: global income inequality reverses course

Money Moves
By Newzino Staff |

After Two Centuries of Widening, the Gap Between Rich and Poor Countries Is Shrinking

November 19th, 2024: Data Confirms Continued Global Inequality Decline

Overview

For two centuries, global inequality moved in one direction: up. The gap between the world's richest and poorest countries widened from 1820 until the 1980s, when it began falling for the first time since the Industrial Revolution. The global Gini coefficient dropped from 70 points in 1990 to 62 points by 2019β€”a decline driven almost entirely by rapid income growth in China, India, and other populous developing nations.

This structural shift rewrote the world income distribution. In 1980, the richest 10% of the global population earned 53 times what the poorest 50% earned. By 2020, that ratio had fallen to 38. More than 800 million people in China alone escaped extreme poverty. The decline paused during COVID-19β€”2020 saw the largest single-year increase in global inequality since measurements beganβ€”but the underlying forces driving convergence remain active.

Key Indicators

70 β†’ 62
Global Gini coefficient (1990-2019)
The standard measure of inequality fell 8 points over three decades.
800M+
People lifted from extreme poverty in China
China accounted for over 70% of global poverty reduction since 1980.
53 β†’ 38
Top 10%/Bottom 50% income ratio
The gap between richest and poorest halved between 1980 and 2020.
~2027
Projected turning point
Some researchers predict inequality will begin rising again as China converges and Africa's population grows.

Interactive

Exploring all sides of a story is often best achieved with Play.

Ever wondered what historical figures would say about today's headlines?

Sign up to generate historical perspectives on this story.

Sign Up

Debate Arena

Two rounds, two personas, one winner. You set the crossfire.

People Involved

Branko Milanovic
Branko Milanovic
Economist, inequality researcher (Presidential Professor at CUNY Graduate Center)
Thomas Piketty
Thomas Piketty
Economist, inequality researcher (Professor at Paris School of Economics)

Organizations Involved

WO
World Bank Group
International Development Institution
Status: Primary data source for global poverty and inequality metrics

Maintains the Poverty and Inequality Platform providing poverty estimates for 170+ economies.

World Inequality Lab
Research Institution
Status: Maintains World Inequality Database

Produces the most comprehensive database on historical income and wealth inequality across countries.

Timeline

  1. Data Confirms Continued Global Inequality Decline

    Data

    Updated figures show global income inequality continues multi-decade decline, driven by growth in non-Western economies.

  2. World Inequality Report 2022 Released

    Research

    Piketty, Chancel, Saez, and Zucman document that global inequality remains at early 20th-century levels despite recent decline.

  3. COVID-19 Reverses Progress

    Crisis

    Pandemic causes largest single-year increase in global inequality since 1990. 97 million more people fall into extreme poverty.

  4. Global Gini Falls to 62

    Data

    Three decades of decline bring global inequality to lowest level since early 20th century.

  5. Elephant Curve Published

    Research

    Lakner and Milanovic publish iconic chart showing globalization's winners and losers from 1988-2008.

  6. Within-Country Inequality Divergence Accelerates

    Research

    While between-country inequality falls, inequality within countries rises in both developed and developing economies.

  7. Global Poverty Rate: 36%

    Data

    World Bank begins systematic tracking. 1.9 billion people live in extreme poverty.

  8. Great Convergence Begins

    Milestone

    Developing countries begin sustained growth exceeding advanced economies. Between-country inequality starts falling.

  9. Global Inequality Reaches All-Time High

    Milestone

    Top 10%/Bottom 50% ratio hits 53β€”the highest ever recorded. Global Gini approximately 0.70.

  10. China Begins Market Reforms

    Policy

    Deng Xiaoping initiates economic reforms that will lift 800+ million people from poverty over four decades.

  11. Simon Kuznets Proposes Inverted-U Curve

    Research

    Economist Simon Kuznets hypothesizes that inequality rises then falls as economies develop.

  12. Between-Country Inequality Peaks (First Wave)

    Historical

    Western imperialism reaches peak. Top 10% earn 41 times what bottom 50% earn, up from 18 in 1820.

  13. Global Inequality Begins Rising

    Historical

    Industrial Revolution concentrates economic growth in Western Europe and North America. Global Gini around 0.50.

Scenarios

1

Convergence Continues: Global Inequality Falls Through 2050

Discussed by: World Bank projections, Hellebrandt and Mauro (2015)

If current growth differentials persistβ€”developing economies outpacing advanced onesβ€”the global Gini could fall to 61 by 2035 and continue declining. India and Southeast Asia would follow China's trajectory, lifting billions more into the global middle class. This scenario assumes no major global shocks and continued trade integration.

2

Turning Point Around 2027: Inequality Begins Rising Again

Discussed by: World Inequality Lab working papers, demographic researchers

China's convergence with rich countries means it no longer pulls global inequality down. Meanwhile, rapid population growth in Sub-Saharan Africaβ€”where incomes remain lowβ€”shifts the global distribution. By 2027, these forces combine to reverse the decline. Global inequality begins rising for the first time in four decades.

3

Within-Country Inequality Dominates: Mixed Picture Emerges

Discussed by: World Inequality Report 2022, Piketty and colleagues

Between-country inequality continues falling, but rising inequality within countriesβ€”particularly in the US, China, and Indiaβ€”offsets gains. The global top 1% captures a growing share while middle classes stagnate. By 2050, global inequality could match today's levels despite convergence, as billionaire wealth grows three times faster than average.

4

Climate Shock Reverses Progress

Discussed by: World Inequality Lab 2025 working paper

Climate change impacts fall disproportionately on developing countries. In high-impact scenarios, the bottom 50% of global population absorbs three-quarters of relative income losses. Global inequality returns to 1980 levels by mid-century as agricultural yields collapse in tropical regions and climate migration accelerates.

Historical Context

The Great Divergence (1820-1980)

1820-1980

What Happened

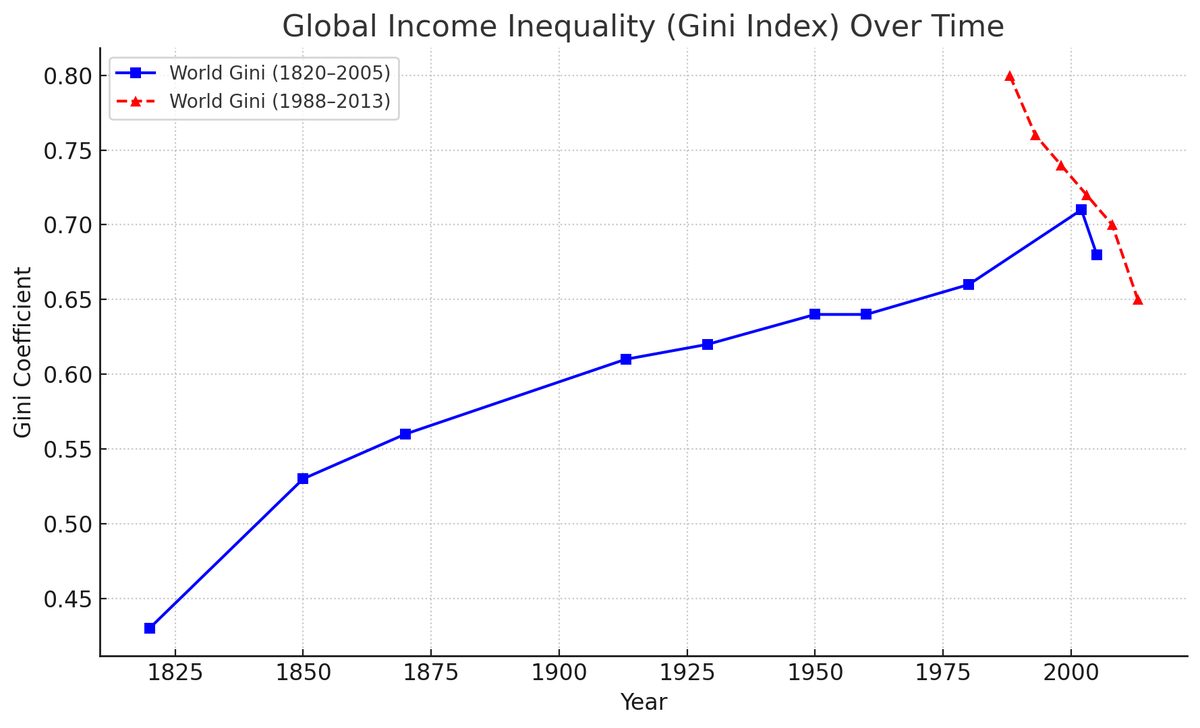
The Industrial Revolution concentrated economic growth in Western Europe and North America. Britain, then the US, pulled away from the rest of the world. By 1980, Western countries controlled two-thirds of global income despite comprising a fraction of world population. The global Gini rose from 0.50 to 0.70.

Outcome

Short Term

Living standards in industrialized countries rose dramatically while most of Asia and Africa remained subsistence economies.

Long Term

Created the 'developed' vs 'developing' world division that persisted until the 1990s. Established the baseline from which current convergence is measured.

Why It's Relevant Today

The current decline in global inequality is a reversal of this 160-year trendβ€”the first sustained movement toward equality since industrialization began.

Asian Tigers Rapid Development (1960s-1990s)

1960-1997

What Happened

South Korea, Taiwan, Hong Kong, and Singapore achieved 7.5% annual growth for three decades through export-oriented industrialization, investment in education, and strategic government intervention. South Korea went from GDP per capita similar to Ghana's in 1960 to matching European levels by 1997.

Outcome

Short Term

Four small economies achieved developed-country status within a generation. Land reforms in South Korea and Taiwan reduced inequality during growth.

Long Term

Provided the template that China and other Asian economies would follow. Demonstrated that rapid convergence was possible outside the West.

Why It's Relevant Today

Showed that developing countries could grow faster than rich countries and narrow the global gapβ€”a pattern China and India later replicated at massive scale.

China's Reform and Opening (1978-2020)

1978-2020

What Happened

Deng Xiaoping's market reforms transformed China from a closed agrarian economy to the world's manufacturing hub. GDP per capita rose 7-fold. Over 800 million people escaped extreme povertyβ€”accounting for 70% of global poverty reduction.

Outcome

Short Term

Created the world's largest middle class. Chinese workers moved from farms to factories, driving the 'elephant trunk' in Milanovic's famous chart.

Long Term

Single-handedly bent the global inequality curve downward. By 2024, China is too wealthy to continue pulling global inequality downβ€”its convergence effect is nearly exhausted.

Why It's Relevant Today

China's rise is the primary cause of declining global inequality since 1980. As China's growth slows and its population ages, the question is whether India and Africa can continue the convergence.

10 Sources: