In 1820, global economic output stood at roughly $1.2 trillion in today's dollars. By 2025, it exceeded $120 trillion—a hundredfold expansion. For the 1,800 years before 1820, total world output had grown perhaps sixfold. The past two centuries compressed more material transformation than the previous eighteen. Yet as 2026 unfolds, major economic institutions warn this growth is slowing: the 2020s are on track to be the weakest decade for global expansion since the 1960s.
The distribution of this growth continues to evolve. Britain pulled ahead first, then Western Europe and North America, creating a 'Great Divergence' from Asia that peaked around 1950. Since then, convergence has begun: China's share of global GDP climbed from under 5% in 1980 to over 18% today, while extreme poverty has fallen from 76% of humanity to roughly 10%. But convergence patterns are now fragmenting—India maintains 6.2% growth while advanced economies slow to 1.8%, and geoeconomic tensions threaten to reverse progress in the world's poorest regions.
Click a figure to generate their perspective on this story
Debate Arena
Two rounds, two personas, one winner. You set the crossfire.
Choose Your Battle
Watch two AI personas debate this story using real evidence
Make predictions and set the crossfire to earn XP and cred
Select Your Champions
Choose one persona for each side of the debate
DEBATE TOPIC
SIDE A (PRO)
Select debater for this side:
✓
SIDE B (CON)
Select debater for this side:
✓
Choose personas with different perspectives for a more dynamic debate
VS
Get ready to make your prediction...
Round of
Claim
Evidence
Stakes
Crossfire Answer
Closing Statement
Claim
Evidence
Stakes
Crossfire Answer
Closing Statement
Your Crossfire Question
Generating arguments...
Who's Got This Round?
Make your prediction before the referee scores
Correct predictions earn +20 XP
Evidence
40%
Logic
30%
Detail
20%
Style
10%
Round Results
Your Pick!
+20 XP
Your Pick
Not this time
Evidence (40%)
Logic (30%)
Detail (20%)
Style (10%)
Overall Score
/10
Your Pick!
+20 XP
Your Pick
Not this time
Evidence (40%)
Logic (30%)
Detail (20%)
Style (10%)
Overall Score
/10
Set the Crossfire
Pick the question both personas must answer in the final round
Crafting crossfire questions...
Choosing a question earns +10 XP crossfire bonus
🏆
Total XP Earned
Cred Change
Predictions
Debate Oracle! You called every round!
Sharp Instincts! You know your debaters!
The Coin Flip Strategist! Perfectly balanced!
The Contrarian! Bold predictions!
Inverse Genius! Try betting the opposite next time!
XP Breakdown
Base completion+20 XP
Rounds played ( rounds x 5 XP)
+ XP
Correct predictions ( correct x 20 XP)
+ XP
Crossfire bonus+10 XP
Accuracy
%
Prediction History
Round
You picked:
✓✗
Keep debating to level up your credibility and unlock achievements
People Involved
Angus Maddison
Economic Historian (Deceased (1926-2010))
Kenneth Pomeranz
Economic Historian (Professor at University of Chicago)
Organizations Involved
MA
Maddison Project
Academic Research Initiative
Status: Maintains authoritative historical GDP database
Collaborative effort by economists to maintain, update, and extend Angus Maddison's historical GDP datasets.
WO
World Bank Group
International Development Institution
Status: Primary source for contemporary GDP and poverty data
International development institution that publishes authoritative global economic statistics and poverty measurements.
Timeline
Global Economy Passes 100x 1820 Levels
Milestone
World GDP exceeds $120 trillion (2021 dollars), more than one hundred times the approximately $1.2 trillion output in 1820. Population has grown eightfold; output per person roughly twelvefold.
IMF Projects Global Growth Steady at 3.3%
Economic Forecast
IMF's January World Economic Outlook projects global growth at 3.3% for 2026, revised slightly up from October 2025. Technology investment and AI offset trade policy headwinds, but advanced economies slow to 1.8% while emerging markets maintain stronger momentum.
World Bank Warns 2020s May Be Weakest Growth Decade Since 1960s
Economic Forecast
World Bank's Global Economic Prospects projects growth easing to 2.6% in 2026 before rising to 2.7% in 2027. Report warns that if forecasts hold, the 2020s will be the weakest decade for global growth in over 60 years, despite 'notable resilience' in developed economies.
COVID-19 Disrupts Global Convergence
Crisis
Pandemic adds 50 million to extreme poverty count—first substantial increase in a generation. Developing economies hit harder than advanced ones.
Global Extreme Poverty Falls Below 11%
Milestone
World Bank data shows extreme poverty rate at 11.2%, down from 37.8% in 1990. Over 1 billion people lifted above poverty line in 24 years.
China Joins WTO
Policy
China's accession to World Trade Organization integrates world's most populous country into global trading system, accelerating manufacturing shift to Asia.
Post-Cold War Globalization Accelerates
Economic Shift
Fall of Iron Curtain opens new markets. Global poverty rate: 37.8%. Over the next 25 years, 1 billion people will exit extreme poverty.
China Begins Market Reforms
Policy
Deng Xiaoping initiates 'Reform and Opening Up.' China's share of global GDP will rise from under 2% to over 18% in four decades.
East Asian Tigers Begin Rapid Industrialization
Economic Shift
South Korea, Taiwan, Hong Kong, and Singapore launch export-oriented development strategies. Each will achieve 7%+ annual growth for three decades.
Marshall Plan Signed
Policy
US commits $13.3 billion to European reconstruction. European industrial production rises 35% by 1952—the fastest growth period in European history.
First Wave of Globalization Peaks
Milestone
Trade reaches 14% of global GDP, up from 6% in the early 19th century. Era ends with World War I.
Second Industrial Revolution Begins
Economic Shift
Electrical power, steel production, and chemical manufacturing drive new growth wave. Global GDP roughly quadruples from 1820 levels.
Industrialization Spreads to Continental Europe and US
Economic Shift
Britain's industrial techniques diffuse to Belgium, France, Germany, and the northeastern United States. Railroad construction accelerates.
Baseline Year for Modern Economic Measurement
Data Milestone
Maddison Project uses 1820 as standard starting point for reliable global GDP comparisons. World output: approximately $1.2 trillion (2021 dollars). Population: roughly 1 billion.
Industrial Revolution Begins in Britain
Economic Shift
Cotton mills, steam engines, and iron production transform British manufacturing. The transition from hand production to machines marks the start of modern economic growth.
Scenarios
1
Convergence Continues: Emerging Markets Reach 60% of Global GDP by 2050
Discussed by: PwC, Capital Economics, IMF long-term projections
If current trends persist, emerging economies—growing roughly twice as fast as advanced ones—will command 60% of world output by mid-century. India becomes the world's third-largest economy, potentially second. China and the US together account for roughly 35% of global GDP. This scenario assumes continued technology transfer, stable trade relationships, and no major geopolitical disruptions.
2
Divergence Returns: Growth Slowdown Widens Rich-Poor Gap
Discussed by: World Bank Global Economic Prospects, Branko Milanovic inequality research
Demographics, debt burdens, and fragmented trade reverse two decades of convergence. China's aging population (projected 520 million over 65 by 2050) slows its growth. Africa and South Asia fail to replicate East Asian manufacturing pathways. Excluding China and India, the world Gini coefficient for income inequality rises rather than falls.
3
Automation-Driven Supergrowth: AI Doubles Productivity Growth Rates
Artificial intelligence and automation raise global productivity growth from its recent 1-2% trend to 3-4% annually. The world economy could triple by 2050 rather than merely double. However, gains concentrate in countries with advanced AI capabilities, potentially widening the gap between technological leaders and others.
4
Climate-Constrained Growth: Environmental Limits Bend the Curve
Discussed by: IPCC economic assessments, World Bank climate reports
Climate change damages—extreme weather, agricultural disruption, sea-level rise—subtract 10-23% from global GDP by 2100 compared to no-warming scenarios. Developing economies in tropical regions bear disproportionate costs. Energy transition investments boost some sectors while stranding assets in others. Growth continues but at reduced rates.
5
Inflation Divergence Fragments Global Recovery: Tariff-Imposing Economies vs. Targeted Economies Split
Discussed by: World Bank Global Economic Prospects January 2026, Deloitte Global Outlook 2026
Trade policy shifts create divergent inflation patterns that fragment recovery trajectories. Tariff-imposing economies experience higher import costs feeding into headline inflation, while targeted economies continue demand-driven disinflation. This divergence leads to asynchronous monetary policy cycles, disrupting capital flows and complicating convergence. Growth gaps widen between economies benefiting from technology investment and those bearing trade friction costs.
Historical Context
The Great Divergence (1750-1950)
1750-1950
What Happened
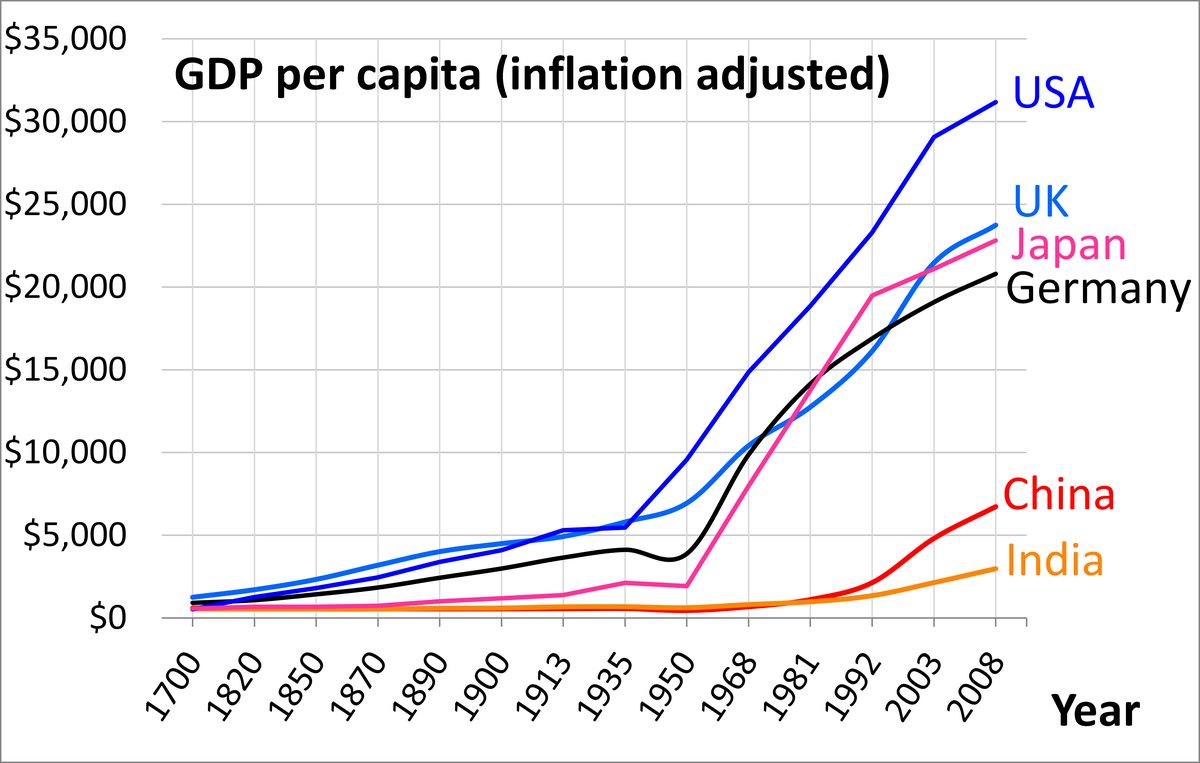
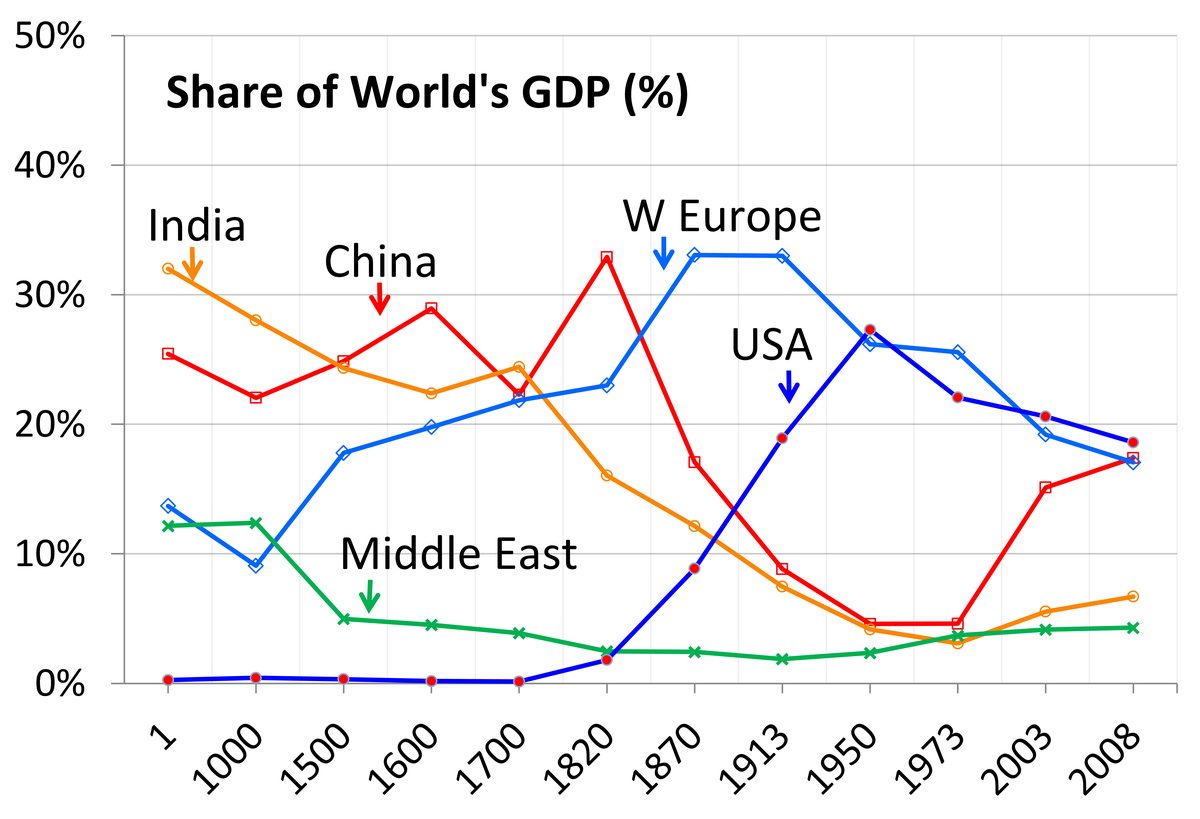
In 1750, China and India together produced roughly half of world output, and living standards in their prosperous regions roughly matched England's. By 1950, Western Europe and North America commanded the majority of global GDP, while China's share had fallen from 33% to under 5%. This 200-year separation of economic trajectories represents the largest divergence in human history.
Outcome
Short Term
Europe and its offshoots (US, Canada, Australia) achieved industrial economies and rising living standards while Asia's relative position declined.
Long Term
The gap peaked around 1950 at roughly 20:1 in GDP per capita between the richest and poorest regions. Convergence began thereafter, accelerating after 1980.
Why It's Relevant Today
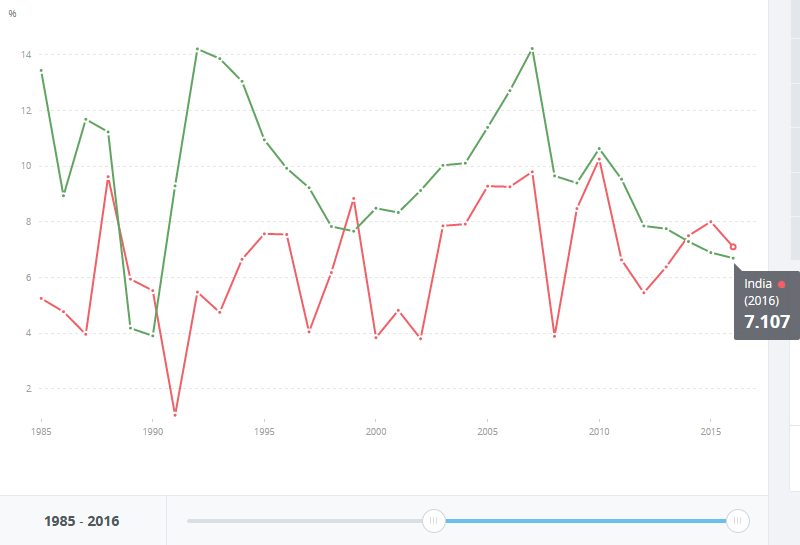
Today's hundredfold expansion is inseparable from the Great Divergence. Most growth occurred in a subset of countries first, then diffused—a pattern now repeating as China and India close the gap.
Marshall Plan Recovery (1948-1952)
April 1948 - December 1952
What Happened
The United States transferred $13.3 billion (roughly $170 billion in 2024 dollars) to 17 Western European countries devastated by World War II. Economist Bradford DeLong called it 'history's most successful structural adjustment program.' By 1952, every recipient had surpassed pre-war output levels.
Outcome
Short Term
European industrial production rose 35% in four years—the fastest growth in European history to that point.
Long Term
The Marshall Plan catalyzed European integration, leading to the European Coal and Steel Community and eventually the EU. It demonstrated that coordinated investment could accelerate growth dramatically.
Why It's Relevant Today
The Marshall Plan showed that targeted investment and institutional reform can compress decades of growth into years—a model later emulated by East Asian development strategies.
The East Asian Miracle (1960-1997)
1960-1997
What Happened
South Korea, Taiwan, Singapore, and Hong Kong—all poor and war-damaged in 1960—achieved sustained 7%+ annual growth for three decades. South Korea's GDP per capita rose from roughly $1,000 in 1960 to over $12,000 by 1997. Each country combined export-oriented manufacturing, heavy education investment, and active industrial policy.
Outcome
Short Term
The Four Tigers became high-income economies within a generation, contradicting theories that poor countries remained trapped.
Long Term
Their model influenced China's development strategy and established East Asia as a global manufacturing center. The 1997 financial crisis exposed vulnerabilities but did not reverse the transformation.
Why It's Relevant Today
The East Asian Miracle proved that rapid convergence was possible—that poor countries could achieve rich-country living standards within decades, not centuries. This precedent shapes current expectations for India, Vietnam, and others.