

California duck curve (2014-2020)
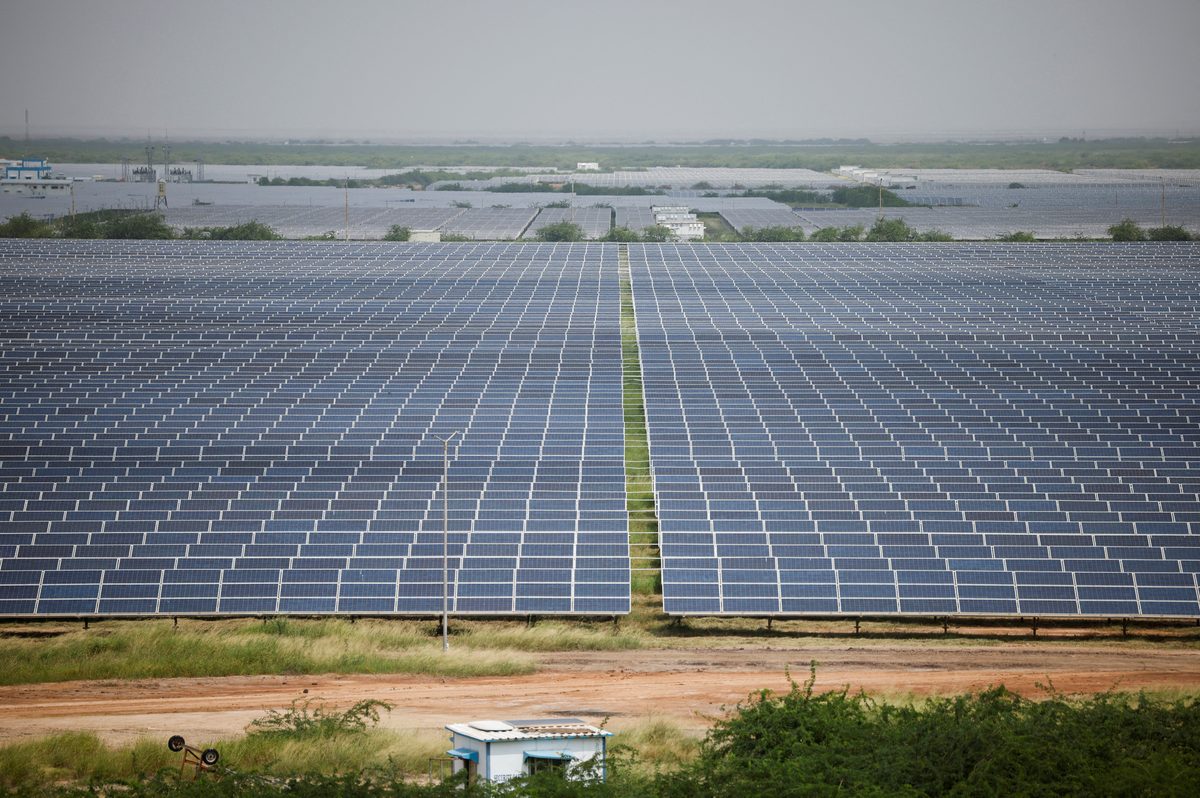
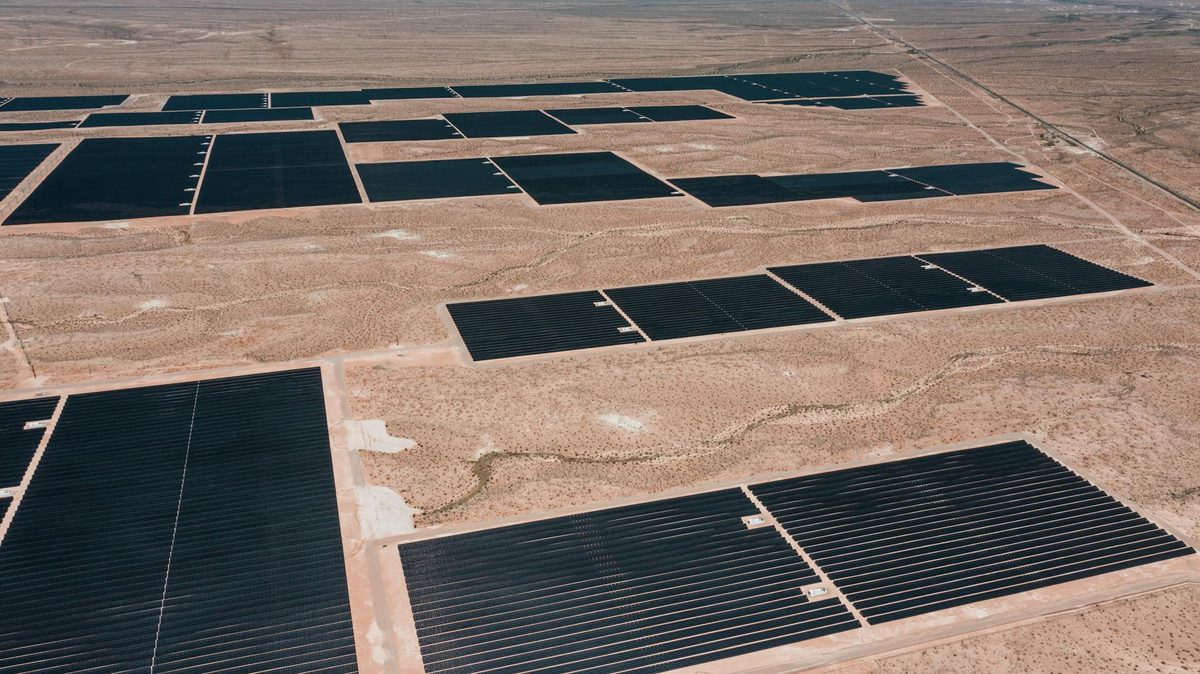
As California's solar fleet crossed roughly 10 gigawatts, the California Independent System Operator's mid-day net load curve sagged into the now-famous 'duck' shape. Solar generation at noon began outstripping demand, and grid operators curtailed renewable output—peaking at over 1.5 terawatt-hours curtailed in 2020.
California began paying neighbors to take surplus power, sometimes at negative prices, and curtailed an increasing share of solar generation each year through 2020.
The state mandated procurement of grid-scale batteries—reaching over 10 gigawatts by 2024—and curtailment rates stabilized as storage absorbed the mid-day peak and discharged it into the evening ramp.
California faced the same mid-day surplus problem India is now hitting, and the fix that worked—massive battery storage paired with market reforms—is exactly what India's CEA and Grid-India have begun to plan but not yet procured at scale.