Pull to refresh
Logo
Daily Brief
Following
Why Ranks Sign Up
Q1 2026 GDP release lands amid sharpest forecaster split of the cycle

Q1 2026 GDP release lands amid sharpest forecaster split of the cycle

Money Moves

Advance estimate arrives one day after a divided Fed held rates, with the Atlanta Fed nowcast and market consensus pointing in opposite directions

April 30th, 2026: BEA releases Q1 advance GDP and core PCE

Overview

The Bureau of Economic Analysis released its first estimate of US economic growth for the first three months of 2026 at 8:30 a.m. Eastern, alongside the Federal Reserve's preferred inflation gauge. Forecasters diverged more than at any point in the cycle: Atlanta Fed's real-time nowcast is 1.2% annualized, traders on the prediction market Polymarket predicted 2.0%-3.0%.

The gap sits at the center of the soft-landing question — whether the Fed can hold inflation down without tipping the economy into recession. A reading near the Atlanta Fed's nowcast would suggest housing and manufacturing weakness is starting to overwhelm consumer spending. A reading at the upper end of market consensus would signal the consumer engine is still running hot, complicating the case for rate cuts and shaping the inheritance handed to Chair Jerome Powell's successor.

Why it matters

Where Q1 GDP lands shapes whether mortgage rates, credit-card APRs, and small-business loans get cheaper this summer.

Questions about this story

No questions yet — be the first to ask.

Play on this story Voices Debate Predict

Key Indicators

1.2%
Atlanta Fed GDPNow estimate
Real-time nowcast from the Atlanta Fed entering release day, weighted toward weak housing and manufacturing data.
2.0–3.0%
Polymarket consensus range
Where prediction-market traders clustered ahead of release, reflecting confidence in resilient consumer spending.
3.50–3.75%
Federal funds rate
Held steady on April 29 by an unusually divided Federal Open Market Committee.
+1.7%
March retail sales month-over-month
Stronger than expected, fueling the higher end of market growth forecasts.

Voices

Curated perspectives — historical figures and your fellow readers.

Ever wondered what historical figures would say about today's headlines?

Sign up to generate historical perspectives on this story.

Play

Exploring all sides of a story is often best achieved with Play.

Log in to play. Track your picks, climb the leaderboards. Log in Sign Up
Predict 4 ways this could play out. Contrarian picks score more — points lock when the scenario resolves. Log in to play
Connections Sixteen names from the news. Find the four hidden groups of four. Log in to play

People Involved

Organizations Involved

Timeline

September 2025 April 2026

4 events Latest: April 30th, 2026 · 1 month ago
Tap a bar to jump to that date
  1. BEA releases Q1 advance GDP and core PCE

    Latest Economic Data

    The Bureau of Economic Analysis publishes the first estimate of Q1 2026 GDP alongside the Personal Income and Outlays report, the Fed's key inflation input.

  2. Fed holds rates with a divided committee

    Monetary Policy

    The FOMC keeps the federal funds rate at 3.50–3.75% but releases statement language reflecting unusually wide internal disagreement on the next move.

  3. March retail sales surprise on the upside

    Economic Data

    Retail sales rise 1.7% month-over-month, reinforcing the case that consumer spending is still propelling growth despite weaker housing and factory data.

  4. Fed begins cautious easing path

    Monetary Policy

    After holding through mid-2025, the Federal Reserve resumes gradual rate cuts toward the current 3.50–3.75% range as inflation drifts toward target.

Historical Context

2 moments from history that rhyme with this story — and how they unfolded.

February 1994 – December 1995

Greenspan's 1995 soft landing

Federal Reserve Chair Alan Greenspan raised the federal funds rate from 3% to 6% over 1994 to cool an overheating economy, then paused and began cutting in mid-1995 as growth slowed without tipping into recession. GDP held positive throughout, and inflation stayed contained.

Then

The economy avoided recession and entered the late-1990s expansion. Markets, initially shaken by the 1994 bond rout, recovered as the easing cycle took hold.

Now

The episode became the canonical example of a successful soft landing and is the historical template policymakers and analysts cite when arguing the current cycle can resolve benignly.

Why this matters now

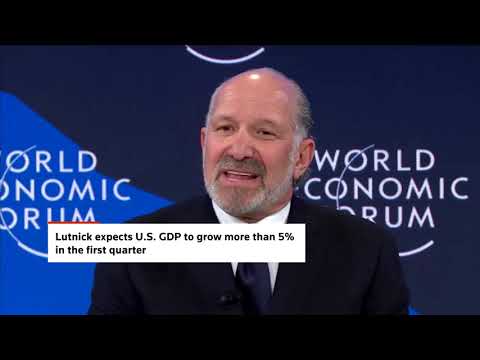
The 1995 cycle is the explicit reference point for the soft-landing thesis being tested by today's release. A Q1 2026 print near consensus with cooling PCE would map closely onto that template.

Q1 2000 – Q1 2001

The 2000 turning point

After the Fed raised rates through 1999 and early 2000 to address tech-driven excess, GDP growth decelerated through 2000. The economy slipped into recession in March 2001 as business investment collapsed alongside the dot-com bust.

Then

The Fed cut rates aggressively from 6.5% to 1.75% across 2001, but the recession ran its course and unemployment continued rising into 2003.

Now

The episode showed that quarterly GDP can hold up while underlying drivers — in that case business investment — quietly hollow out, with the official turn arriving only after the data confirmed it.

Why this matters now

A weak Q1 2026 reading driven by housing and manufacturing — even with consumer spending intact — would echo the 2000 dynamic, where one sector's strength masked broader deterioration until it didn't.

Sources

(3)