Pull to refresh
Logo
Daily Brief
Following
Why Sign Up
U.S. health care spending growth hits its slowest stretch since tracking began in 1960

U.S. health care spending growth hits its slowest stretch since tracking began in 1960

Rule Changes
By Newzino Staff |

A Brookings analysis finds spending came in nearly $1 trillion below forecasts, driven by cheaper technology and generic drugs

March 27th, 2026: Brookings paper confirms the cost curve has bent

Overview

For decades, American health care spending grew faster than the economy, seemingly without limit. Government actuaries projected in 2010 that health care would consume 21.2 percent of gross domestic product (GDP) by 2024—roughly $6.3 trillion. The actual figure: 18 percent, about $977 billion less than expected. A new analysis presented at the Brookings Institution on March 27, 2026, concludes that the United States has genuinely bent its health care cost curve for the first time in the modern era.

Why it matters

A nearly $1 trillion gap between projected and actual health spending reshapes what the country can afford to fund.

Key Indicators

$977B
Spending below 2010 forecast
Actual 2024 health spending came in 15 percent below what government actuaries projected in 2010.
18%
Health care as share of GDP (2024)
Up slightly from 17.2 percent in 2010, but far below the projected 21.2 percent.
14 years
Unprecedented slow-growth period
No 14-year stretch since 1960 has seen health spending grow this slowly relative to GDP.
24%
Savings from price reductions
Price declines in imaging and the shift to generic drugs accounted for roughly a quarter of the spending gap.
21%
Savings from cost-saving technology
Medical technologies that reduce rather than increase costs drove about a fifth of the slowdown.

Interactive

Exploring all sides of a story is often best achieved with Play.

Ever wondered what historical figures would say about today's headlines?

Sign up to generate historical perspectives on this story.

Sign Up

Debate Arena

Two rounds, two personas, one winner. You set the crossfire.

People Involved

Organizations Involved

Timeline

  1. Brookings paper confirms the cost curve has bent

    Research

    David Cutler and Lev Klarnet presented findings at the BPEA conference showing 2024 health spending came in $977 billion below 2010 projections—the slowest 14-year growth stretch since systematic tracking began in 1960.

  2. First negotiated Medicare drug prices take effect

    Policy

    Negotiated prices for ten high-cost drugs went into effect, with reductions of 38 to 79 percent. The program is estimated to save Medicare $6 billion per year and beneficiaries $1.5 billion in out-of-pocket costs.

  3. NBER paper asks whether the bend will hold

    Research

    An NBER working paper by Cutler and colleagues examined whether the spending slowdown would persist, noting that some factors appeared temporary while others looked structural.

  4. Inflation Reduction Act adds Medicare drug negotiation

    Legislation

    President Biden signed the Inflation Reduction Act, giving Medicare authority to negotiate prices on high-cost drugs for the first time—a new mechanism expected to add downward pressure on spending.

  5. Health Affairs finds ACA 'dented' the cost curve

    Research

    A Health Affairs study concluded the Affordable Care Act contributed to slower health spending growth, though debate continued over how much credit the law deserved versus broader economic forces.

  6. Early debate: recession or structural change?

    Research

    Economists Amitabh Chandra and Jonathan Skinner presented a BPEA paper questioning whether the post-2010 spending slowdown was temporary or lasting, finding mixed evidence.

  7. Generic Drug User Fee Act accelerates approvals

    Legislation

    Congress allowed generic drug manufacturers to pay fees to expedite Food and Drug Administration (FDA) approvals, clearing a backlog and driving down generic prices.

  8. CMS projects health care at 21.2% of GDP by 2024

    Projection

    Government actuaries forecast health spending would reach $6.3 trillion and consume more than a fifth of the economy within 14 years.

  9. Affordable Care Act signed into law

    Legislation

    President Obama signed the Patient Protection and Affordable Care Act, which included cost-containment provisions alongside its coverage expansion. Obama had promised to veto any bill that did not slow health spending growth.

Scenarios

1

Cost curve stays bent as technology and generics deepen savings

Discussed by: Cutler and Klarnet (BPEA paper); Health Affairs analysts who credit structural ACA reforms

Cost-saving medical technology continues to displace expensive treatments, generic drug penetration keeps growing, and Medicare drug negotiation expands to cover 60 or more drugs by 2030. Health spending grows at or below GDP growth for another decade, freeing fiscal space for other priorities. This scenario depends on continued innovation in cost-reducing technology and no major coverage expansions that drive utilization spikes.

2

Spending growth re-accelerates as aging population overwhelms savings

Discussed by: CMS actuaries projecting 20.3% of GDP by 2033; Peterson-KFF Health System Tracker

Baby boomers entering their highest-cost health care years drive demand for expensive chronic disease management, cancer treatments, and long-term care. New weight-loss drugs, gene therapies, and artificial intelligence diagnostics add costs faster than they save. Health spending resumes outpacing GDP growth, and the 2010-2024 period is remembered as a temporary reprieve, not a permanent shift.

3

Political disruption unwinds cost-containment mechanisms

Discussed by: Heritage Foundation and other critics of ACA cost provisions; analysts tracking potential repeal efforts

Congressional action weakens or repeals the Inflation Reduction Act's drug negotiation provisions, rolls back ACA payment reforms, or expands coverage without corresponding cost controls. Without the regulatory scaffolding that helped slow spending growth, prices and utilization return to pre-2010 trend lines. This scenario becomes more plausible if drug manufacturers successfully challenge negotiation authority in court.

4

New cost-saving technologies bend the curve further than expected

Discussed by: Cutler's broader research on medical technology becoming cost-reducing; analysts of AI-driven diagnostics and GLP-1 drug impacts

Artificial intelligence-driven diagnostics, remote monitoring, and highly effective preventive medications (such as GLP-1 drugs reducing cardiovascular events) produce savings that compound over time. Health spending as a share of GDP actually declines from its 2024 level, an outcome with no precedent in modern American history outside recession years.

Historical Context

Medicare and Medicaid launch triggers first cost explosion (1965-1970)

July 1965 – 1970

What Happened

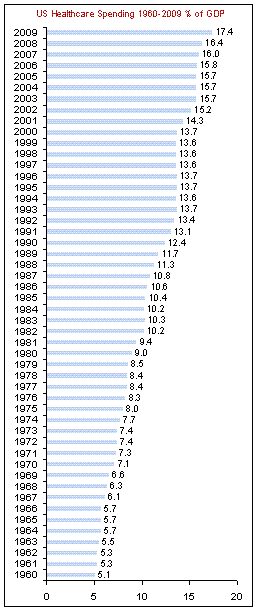
President Lyndon Johnson signed Medicare and Medicaid into law in July 1965, extending government-funded health coverage to 19 million elderly Americans and millions of low-income citizens. Health spending surged from 5.7 percent of GDP in 1965 to 7.0 percent by 1970 as tens of millions of previously uninsured people entered the system.

Outcome

Short Term

Hospital revenues soared and the provider sector expanded rapidly to absorb new demand.

Long Term

Established the pattern of coverage expansion driving spending growth that policymakers have tried to break ever since—the same dynamic the Cutler-Klarnet paper now says has finally changed.

Why It's Relevant Today

The 2010-2024 period inverts this pattern: the ACA expanded coverage to roughly 20 million people while spending growth simultaneously slowed, breaking a 45-year historical link between more coverage and faster cost growth.

Managed care slowdown of the 1990s (1993-2000)

1993 – 2000

What Happened

The rise of health maintenance organizations (HMOs) and managed care plans in the early 1990s temporarily slowed health spending growth. Annual growth dropped from about 10 percent in the late 1980s to under 5 percent by the mid-1990s as insurers restricted provider networks and required pre-authorization for expensive treatments.

Outcome

Short Term

Spending growth hit historic lows and health care's share of GDP briefly stabilized around 13 percent.

Long Term

A consumer backlash against restricted choice led to looser managed care controls by the late 1990s, and spending growth re-accelerated through the 2000s—raising the central question of whether any cost slowdown can last.

Why It's Relevant Today

The 1990s managed care episode is the closest precedent to the current slowdown—and the key cautionary tale. Cutler and Klarnet argue this time is different because the drivers are structural (technology costs falling, generic drug penetration) rather than administrative (restricting access), but skeptics point to the 1990s as evidence that cost curves eventually un-bend.

Hatch-Waxman Act creates the modern generic drug market (1984)

September 1984

What Happened

The Drug Price Competition and Patent Term Restoration Act, sponsored by Senator Orrin Hatch and Representative Henry Waxman, created an abbreviated approval pathway for generic drugs while giving brand-name manufacturers patent extensions. Before the law, generics accounted for less than 20 percent of prescriptions filled.

Outcome

Short Term

Generic drug approvals accelerated and prices for off-patent medications began falling.

Long Term

By 2024, generics accounted for roughly 90 percent of prescriptions dispensed in the United States, making the shift to generics one of the largest sustained cost-saving forces in American health care.

Why It's Relevant Today

The Cutler-Klarnet paper identifies the shift from brand-name to generic drugs as a major contributor to the spending gap. That shift traces directly to the legal framework created by Hatch-Waxman four decades ago—a reminder that cost-curve bending often rests on policy infrastructure built long before the savings materialize.

Sources

(9)